You picked a number back in June. Three million this year. You said it out loud on a team call, wrote it on a whiteboard, and got back to answering emails. It is now the middle of August. Nobody has looked at that number since.
What’s in This Article
That is not a budget. That is a wish with a dollar sign in front of it. And it is the most common gap I find when I open the books of an Aussie Shopify store doing somewhere between 40k and 500k a month.
The cost of getting this wrong is not theoretical. ASIC insolvency data shows inadequate cash flow or excessive cash use was cited in 52% of insolvency reports lodged by administrators, and analysis of that same data set found roughly two thirds of small businesses entering insolvency had no formal forecasting in place at all. These are not businesses that could not sell. They are businesses that never knew what a sale was actually worth.
Compare that to how a listed operator runs the same problem. Temple & Webster reported FY25 revenue of 600.7 million dollars, up 20.7%, with fixed costs held at 10.6% of sales and FY26 earnings margin guidance of 3 to 5%. Notice what is being managed there. Not a revenue number. A set of ratios.
This is the build I run with founders in August, six weeks into the Australian financial year, while there is still time for the plan to change behaviour. Six layers. Roughly a day of work. It will be the highest paid day you spend this year.
A Revenue Goal Is Not a Plan, and Here Is What Breaks First
A revenue goal on its own does exactly one thing: it makes you say yes to more spend. You booked the bigger stand at the trade show because you are a three million dollar business now. You hired the second marketer. You ordered 40% more stock. All of it justified by a top line that has not been tested against a single cost assumption.
The failure is always the same shape. Revenue lands close to target and profit does not. You finish the year up 22% and somehow have less cash in the account than you started with, because the growth was funded by margin you never modelled.
A real budget answers four questions that a revenue goal cannot:
- What has to be true? How much traffic, at what conversion rate, at what basket size, in which month.
- What does each dollar cost to earn? Every deduction between the price on the product page and the cash that stays in the business.
- What is fixed and what flexes? Which costs you can pull back inside 30 days and which ones you are locked into for the year.
- What is the trigger to change course? The specific variance that forces a decision rather than a shrug.
Everything below is built to answer those four. Work through it in order, because each layer feeds the next.
Layer 1: Build the Revenue Line From Drivers, Not From Last Year Plus Twenty Percent
Last year plus twenty is the laziest number in ecommerce. It contains no information about what you would have to actually do differently. Build the top line from the three drivers you can name and influence instead: sessions, conversion rate, and average order value.
Revenue equals sessions multiplied by conversion rate multiplied by AOV. Set that formula per month, not per year, because the three inputs move independently and they move seasonally.
The critical discipline here is being honest about the conversion rate. The Shopify platform average sits near 1.4%, with the top 20% of stores landing between 3.1 and 3.5%. Mobile converts at roughly 1.2% against 2.8% on desktop, so if your traffic mix is shifting to mobile, a flat blended rate in your model is already wrong. If you budget 2.6% next year and you did 1.8% last year, you have not built a plan. You have built a 44% conversion lift into a spreadsheet and called it a forecast.
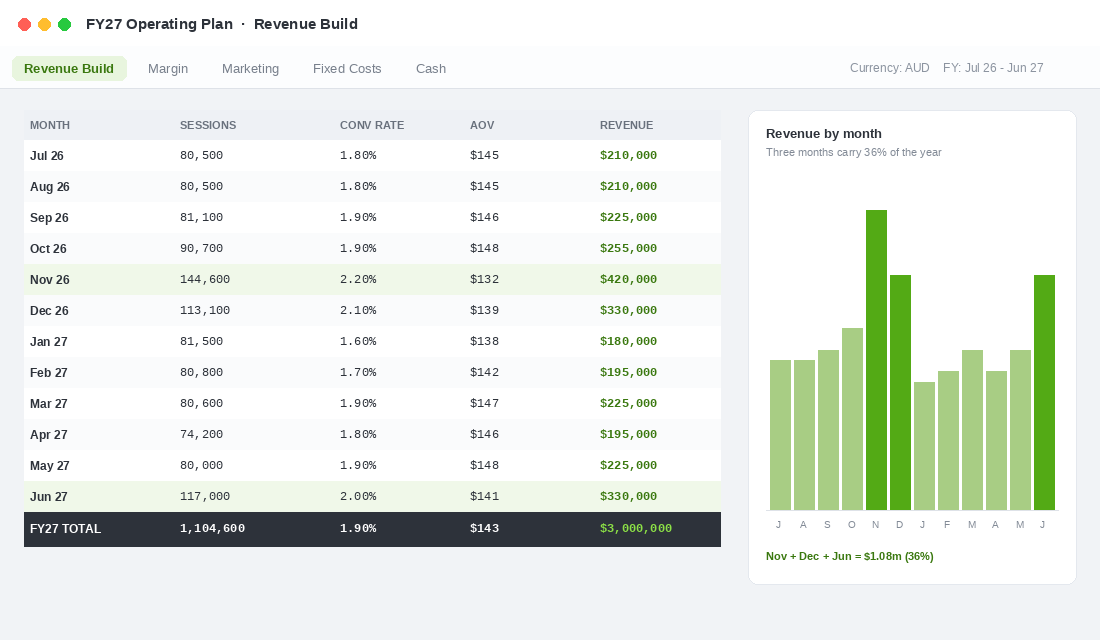
Here is the worked example I use, based on a store that finished FY26 on 2.4 million dollars and wants three million in FY27.
- Sessions: 1,104,600 for the year, weighted heavily into November, December and June.
- Blended conversion rate: 1.9%, up from 1.8%, which is a realistic single year improvement off checkout and product page work.
- AOV: 143 dollars blended, dipping to 132 in November when discounting is deepest and lifting to 148 in the shoulder months.
- Result: three million dollars, but now expressed as 90 thousand extra sessions a month and a tenth of a percentage point on conversion.
That reframing matters. A three million dollar goal is abstract. An extra 90 thousand sessions a month is a media plan, an SEO brief and a partnership target. One of those you can hold someone accountable to.
Sense check every driver against something external before you lock it. If your model needs conversion to jump from the platform average to top decile in twelve months, write down the specific work that delivers it or cut the number.
Layer 2: Run the Full Cost Waterfall Before You Celebrate the Top Line
This is where most budgets quietly fall apart. Founders model revenue and cost of goods, then treat everything else as a rounding error. The rounding errors are where the profit lives.
The median gross margin across public DTC companies sits near 57%, with the bottom quartile at 46%. Adore Beauty, running a retail model rather than an owned brand, posted an FY25 gross margin of 35.3% on revenue of 198.8 million dollars. Two very different businesses, two very different cost structures, and neither number is useful to you unless you have built your own line by line.
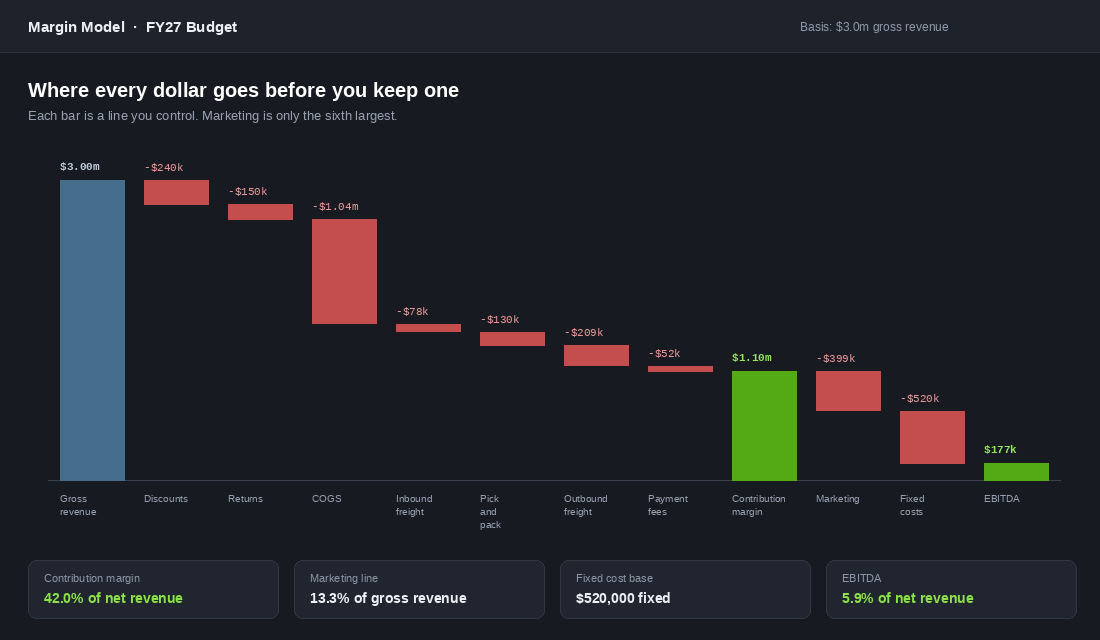
Model these eight deductions separately, as a percentage of gross revenue, so they scale automatically when the top line moves:
- Discounts. Budget 8% on a three million dollar year and you have already committed 240 thousand dollars. Most stores run closer to 11% and never notice.
- Returns. 5% of gross revenue plus the freight and handling to process each one. Apparel and footwear will be double this.
- Cost of goods. 40% of net revenue in the example, landed, including duty and the exchange rate you actually paid rather than the one you hoped for.
- Inbound freight. 3%, and it belongs in cost of goods, not in a mystery bucket at the bottom of the profit and loss.
- Pick and pack. 5%, whether that is a third party logistics invoice or the wages of the person doing it in your garage.
- Outbound freight. 8%, net of whatever the customer pays you. This is the line that quietly eats Australian ecommerce.
- Payment fees. 2% blended across card, buy now pay later and PayPal. Buy now pay later at 4 to 6% pulls this average up fast.
- Marketing. Handled in Layer 3, because it deserves its own rule.
Run that on three million dollars of gross revenue and contribution margin before marketing lands at 1.096 million dollars, or 42% of net revenue. That number, not gross margin, is what funds every other decision you make this year. Our contribution margin audit walks through how to pull each of these lines out of Shopify and Xero if you have never separated them before.
Layer 3: Set the Marketing Line as a Percentage, Not a Dollar Figure
Fixing marketing at a dollar figure is how founders end up either starving a good year or bleeding through a bad one. Set it as a share of revenue and it self corrects.
The benchmarks give you a starting range. Median DTC marketing spend runs at 13.3% of revenue, with the 25th percentile at 9.0% and the 75th at 19.3%. Stage matters more than the median though. Brands between one and five million dollars typically sit at 20 to 30%, dropping toward 15 to 25% between five and ten million as brand search and repeat purchase start carrying load.
For our three million dollar example, 13.3% is 399 thousand dollars. Write it into the budget as the percentage, and then set two guard rails around it:
- A floor. The minimum monthly spend that keeps the account learning and the pipeline warm. Cutting below this in a soft month costs you the following month too.
- A ceiling tied to contribution margin. If contribution margin before marketing is 42%, and you want to keep 6% at the bottom line after fixed costs, marketing plus fixed costs cannot exceed 36% of net revenue. That is the real limit, and it is arithmetic rather than opinion.
Adore Beauty is a useful reference point on efficiency. It brought customer acquisition cost down to 59 dollars in FY25 while still growing new customers 4.9% in the second half. The lesson is not the number, it is that they treated acquisition cost as a managed line with a target, not as whatever the platforms happened to charge that month.
One more rule: budget marketing against net revenue when you are stress testing profitability, and against gross revenue when you are setting the media plan. Mixing the two is how a 13% budget becomes a 16% reality.
Layer 4: Freeze the Fixed Cost Base and Name Your Break-Even Day
Fixed costs are the part of the budget you can only change once a year, which is exactly why they get the least attention. Wages, rent, software, insurance, accounting, the apps you forgot you were paying for. Add them up honestly.
In the worked example that base is 520 thousand dollars. Temple & Webster runs its equivalent at 10.6% of sales at scale. A three million dollar store carrying 520 thousand is at 17.3%, which is normal for that size, and it is the single biggest reason small stores struggle to hold a double digit bottom line.
Now calculate the number that actually changes behaviour. Contribution margin after marketing runs at 23.2% of gross revenue. Divide the fixed cost base by that rate and you get 2.24 million dollars. That is the revenue required just to cover fixed costs before a single dollar of profit appears.
On a typical 250 thousand dollar month, break-even lands around the 23rd. Everything before that pays the bills. Only the last eight days of trading are yours.
Put that date on the wall. It changes how a team thinks about a slow first fortnight, and it makes every subscription renewal a real conversation instead of a reflex. It also tells you exactly how much slack you have: eight days of trading, or roughly 63 thousand dollars a month of contribution, is the entire buffer between plan and trouble.
Before you sign off on the fixed base, run a line by line cull. Every recurring cost gets one of three labels: keeps revenue safe, creates revenue, or neither. The neither pile is usually worth 15 to 20 thousand dollars a year at this size.
Layer 5: Phase the Year, Because December Is Not January
A budget divided by twelve is worse than no budget, because it manufactures a false alarm every January and false comfort every November. Australian ecommerce is violently seasonal and the shape is well documented.
Total online spend in Australia hit 82.6 billion dollars in 2025, up 14% year on year and now 24% of all retail spending, driven by 9.8 million households shopping online, according to the Australia Post eCommerce Report 2026. That volume is not spread evenly. It clusters into peak, and in Australia we get a second spike at the end of the financial year that northern hemisphere benchmarks will never show you.
In the example plan, November, December and June carry 1.08 million dollars, or 36% of the year, across three months. Phase your budget to match, and phase three things with it:
- Stock commitments. Peak inventory is ordered four to six months out, which means your November budget is being spent in July. The open-to-buy method is how you set that ceiling without strangling cash.
- Marketing weight. A flat monthly media budget underspends in the months where the money is and overspends in January when nobody is buying.
- Cash timing. Revenue and cash are not the same month. Supplier deposits, payment processor settlement delays and BAS instalments all shift the timing. Pair this budget with an 8-week rolling cash forecast so you are never surprised by a profitable month with an empty account.
The test of a phased budget is simple: if January comes in 28% below December and nobody panics, the phasing worked.
Layer 6: The Monthly Variance Review That Makes the Budget Real
A budget nobody checks is a document. A budget checked on the same day every month is a management system. This is the layer that separates the two, and it is the one most founders skip.
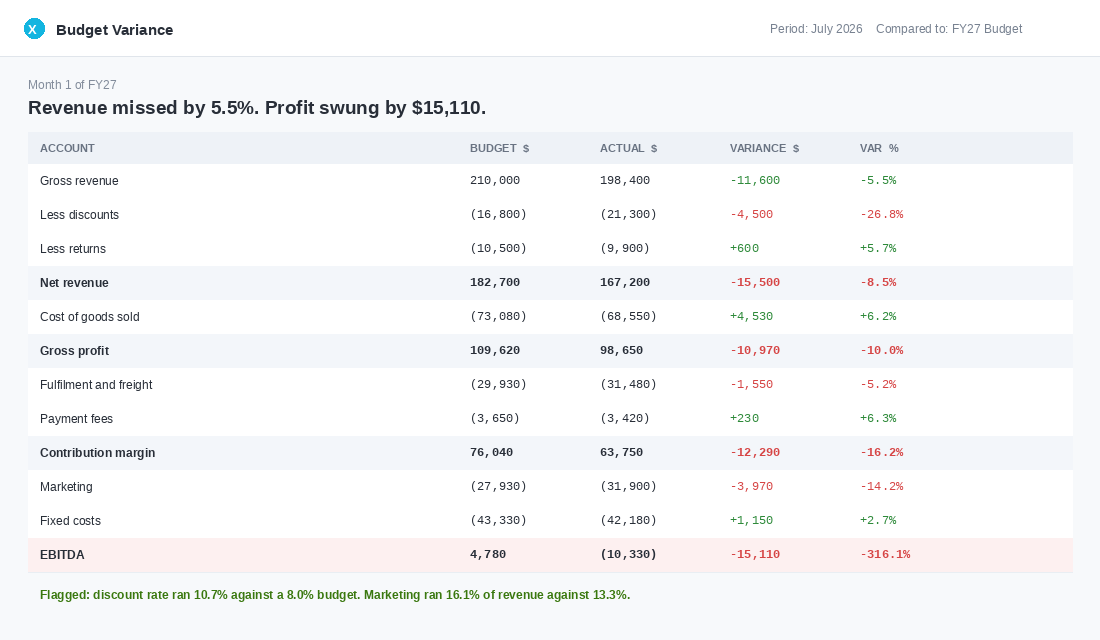
Look closely at that report, because it is the whole argument for doing this work. Revenue missed budget by 5.5%, which most founders would shrug off. But discounting ran at 10.7% against a budgeted 8.0%, and marketing ran at 16.1% of revenue against 13.3%. Earnings went from a budgeted plus 4,780 dollars to an actual minus 10,330. A rounding error at the top became a 15 thousand dollar swing at the bottom.
Set this up in Xero and it takes twenty minutes once, then ten minutes a month:
- Go to Accounting, then Reports, then Budget Manager and click Add New Budget. Name it FY27 Operating Plan.
- Click Import and download Xero’s budget template CSV. Do not type twelve months of numbers into the browser.
- Paste your monthly phased figures from Layer 5 into the template, one row per account. Keep discounts, returns and freight as separate accounts, because a variance you cannot see is a variance you cannot fix.
- Import the file back into Budget Manager and check the annual totals reconcile to your model before saving.
- On the fifth working day of each month, run the Budget Variance report for the month just closed.
- Set a recurring 45 minute calendar block for the same day. Attendance is not optional, including for you.
In the review itself, ask three questions and nothing else. Which line moved most in dollars, not percentage. Is it a timing difference or a real one. What decision does it force this month. A variance discussion that ends without a decision was a status update, and you already had one of those.
Set a trigger too. Mine is straightforward: any month where contribution margin lands more than 10% below budget triggers a full review of pricing, discounting and media inside five working days. No debate about whether it is worth doing.
The One-Page FY27 Plan You Can Build This Week
Open a blank sheet and fill in these twelve lines. If you can do it without guessing, you have a budget. If you cannot, you have found this quarter’s real work.
- Sessions by month, twelve figures
- Conversion rate by month, benchmarked against your own last twelve months
- AOV by month, adjusted down for promotional periods
- Gross revenue by month, calculated from the three lines above
- Discount rate as a percentage of gross revenue
- Returns rate as a percentage of gross revenue
- Landed cost of goods as a percentage of net revenue
- Fulfilment, inbound freight, outbound freight and pick and pack, each as its own percentage
- Payment fees blended across all methods including buy now pay later
- Marketing as a percentage of revenue, with a monthly floor and a contribution based ceiling
- Fixed cost base, annual, with every line labelled keeps revenue safe, creates revenue, or neither
- Break-even revenue and the day of the month it lands on
Twelve lines. Half a day if you have clean data, a full day if you do not. Then load it into Xero and book the monthly review before you close the laptop, because a plan without a review date is just a nicer looking wish.
Why These Six Layers Compound
Taken one at a time, none of this is dramatic. A conversion assumption you can defend. A freight percentage you actually measured. A marketing ceiling tied to contribution rather than to what the account spent last month.
Together they change the speed at which you can make decisions. When a supplier raises prices 6%, you already know what that does to contribution margin and whether you can absorb it. When November comes in 12% under plan, you know within five days whether it was traffic, conversion or basket size, and you know which lever moves fastest. When someone pitches you a 4,000 dollar a month agency retainer, you know exactly what percentage of your fixed base that represents and what revenue it has to produce to justify itself.
That is the real return here. Not the document. The speed. Founders with a live budget make decisions in days that other founders sit on for a quarter, and over twelve months that gap is worth far more than the couple of points of margin the exercise itself recovers.
If you built one of these in June for the year that just closed, run the EOFY profit reset against it first. Comparing last year’s plan to last year’s actuals is the fastest way to calibrate how optimistic you are, and every founder is optimistic in a predictable direction.
Inside eCommerce Circle, building and holding a real operating plan is one of the core pillars we work on with every member. If you want a second opinion on your FY27 numbers before you commit stock and headcount to them, let’s talk.