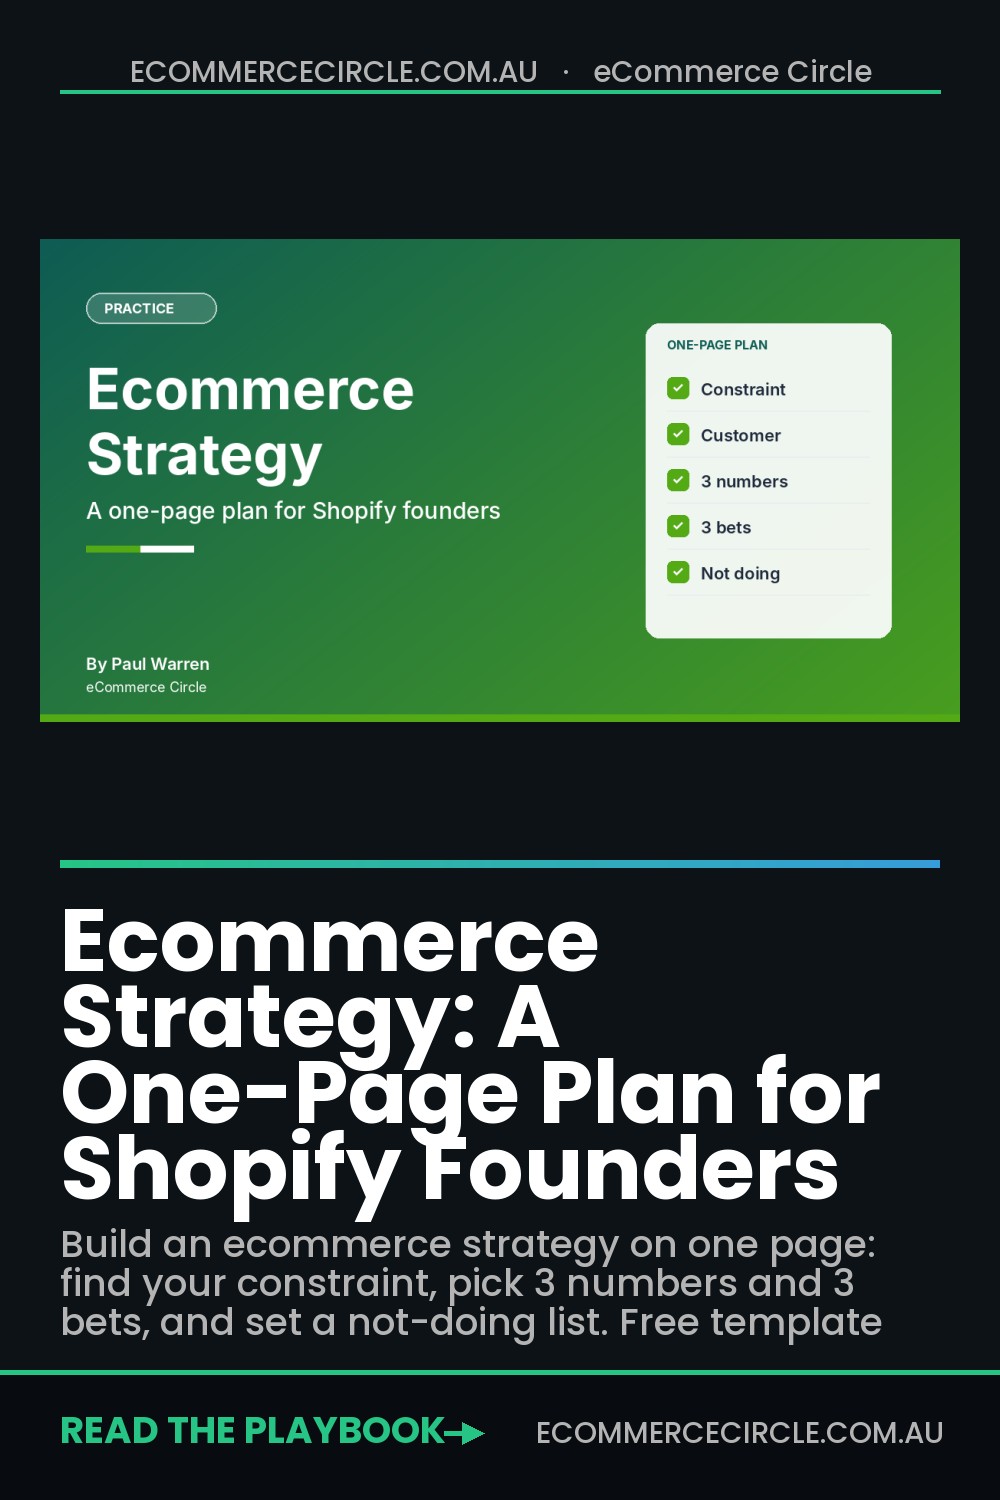
An ecommerce strategy is a one-page document that names the one thing capping your orders, the three numbers you will watch, the three bets you will make in the next 90 days, and the things you refuse to do. If your plan is longer than a page, it is a report, and nobody on your team is reading it.
What’s in This Article
Most Shopify founders I speak to have the opposite problem. They have no written plan at all, just a head full of tactics: run more ads, launch TikTok Shop, redo the homepage, try a loyalty app. Every one of those is a fair idea. Together, with no order and no owner, they are how a store ends up busy for 12 months and flat on revenue.
This guide gives you the one-page structure we use with members inside eCommerce Circle, a worked example with real Australian numbers, and a copy-paste template. It takes about two hours to fill in properly. It will save you months.
What an ecommerce strategy is (and what it is not)
A strategy is a set of choices about where you will focus and where you will not. A business plan tells a bank you understand the market. A marketing calendar tells your team what to send on Tuesday. A strategy sits between them and answers one question: what are we doing this quarter, and why is that the highest-leverage use of our time and cash?
The market gives you plenty of reasons to be selective. According to the Australia Post eCommerce Report 2026, Australians spent a record $82.6 billion online in 2025, up 14% year on year, across 9.8 million households. That is a growing pie, but those households buy from an average of 16 brands a year, and the average basket is $96, which is $10 lower than in 2020. Shoppers are spreading their money wider and spending less per order.
Read that as a founder. Demand is not your problem. Winning a bigger share of each household’s 16 brands, and getting a repeat order out of the ones who already bought, is. That is a strategy question, not a tactics question.
- Not a strategy: “Grow revenue 30% next year.” That is a goal with no choices in it.
- Not a strategy: “Post on Instagram 5 times a week and run Meta ads.” That is a list of activities.
- A strategy: “Our repeat rate is 14% against a category range of 16 to 21%, so for 90 days we fix the post-purchase journey and say no to everything that does not move that number.”
Step 1: Find your one constraint before you plan anything
The most common planning mistake is starting with a wish list. Start with a diagnosis instead. Every store has one block that caps the rest, and until you fix it, extra effort elsewhere returns almost nothing.
We use the 10 P’s of the More Orders Operating System to find it: Product, Prospects, Profit, Patrons, Promotion, Platform, Performance, People, Protection and Practice. Score each one out of 10 using hard evidence, not feelings. A Platform score of 4 means something specific (mobile conversion under 1.2%, a three-second-plus load time). A Patrons score of 3 means your repeat purchase rate is well below your category.
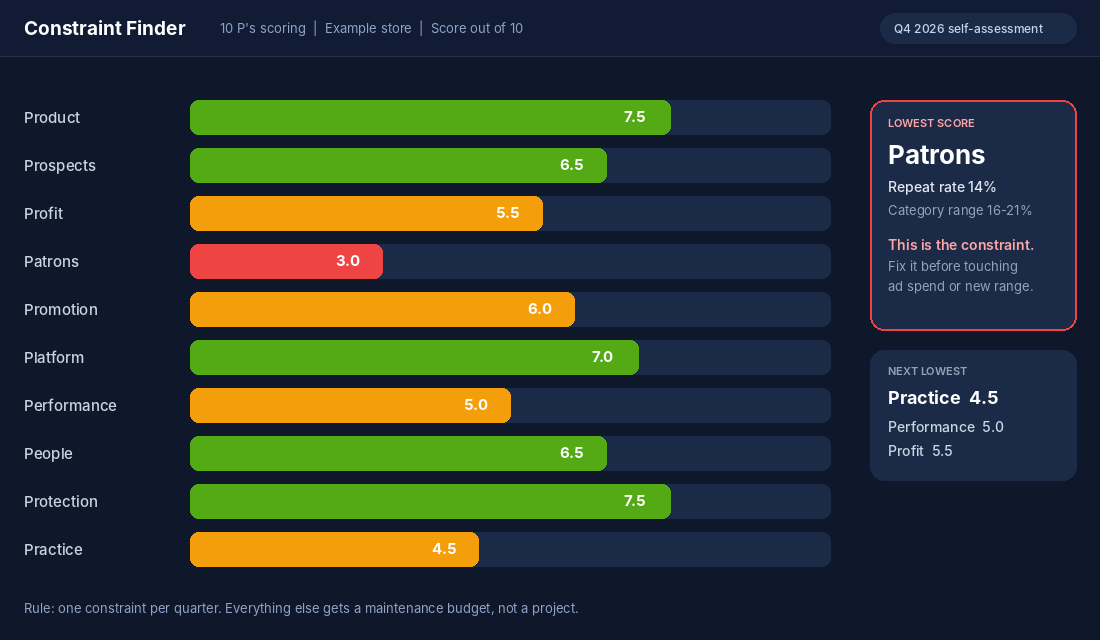
The More Orders Scorecard scores all 10 P’s for you in two minutes if you would rather not build the scoring sheet yourself. Either way, the rule is the same.
The constraint rules
One constraint per quarter. Two constraints means you have not decided.
It must be backed by a number you can pull from Shopify, GA4 or your ad account today.
If your lowest score is a tie, pick the one closer to revenue (Patrons and Promotion beat Practice for most stores).
My rule of thumb: if you cannot name the constraint in one sentence and attach a number, you have not found it yet. Keep digging. Pull your last 90 days of orders and look at repeat rate, AOV, contribution margin and conversion rate before you decide anything.
Step 2: Pick the three numbers that tell you if the plan is working
A one-page plan can carry three numbers, not thirteen. Choose one for profit, one for efficiency and one for the constraint you picked in step one. Here is the default set we start most stores on.
- Contribution margin per order. Revenue minus product cost, shipping, payment fees and ad spend, divided by orders. This is the number that tells you if growth is worth having. If you do not know yours, start with our guide to contribution margin for Shopify.
- MER (marketing efficiency ratio). Total revenue divided by total marketing spend. It cuts through platform attribution arguments and gives you one blended view. Set a floor, for example 2.8, and treat anything below it as a stop sign.
- Your constraint metric. For a retention problem this is repeat purchase rate. For a conversion problem it is conversion rate on mobile. For a margin problem it is contribution margin after discounts.
If retention is your constraint, benchmark yourself honestly. Bluecore’s transaction data across 100+ retailers, reported by Ecommerce Fastlane, puts the average repeat purchase rate at 16.5%, with health and beauty at 21.5%, sporting goods at 21.2% and apparel at 20.2%. The same data shows 74% of customers buy once and never return, and that active buyers spend 69.2% more than new buyers. These are 2023 figures, so treat them as a floor, but they tell you where “normal” sits.
Our repeat customer rate guide shows how to calculate yours from a Shopify export. Do it before you write a target.
Write each number with three values: where you are today, where you want to be in 90 days, and the floor that triggers a rethink. A target without a floor is a hope.
Step 3: Decide who you are winning and why they pick you
Strategy means choosing a customer. If you sell to everyone, your ads, your product pages and your emails all say the same beige thing to everyone. Write a single sentence: “We help [specific person] get [specific outcome] without [specific frustration].”
Melbourne wallet brand Bellroy is a good example of narrowing on purpose. The SmartCompany report on its retail plans says Bellroy sells in more than 150 countries, turned over $146 million in its last financial year, and gets roughly 30 to 40% of sales through third-party retailers, with the rest from its own website and digital marketplaces. It has built a global business around a focused range of wallets, bags and carry accessories, and its CEO describes online as a stable channel now. The next move is stores that must stand on their own, with a target of paying back each fit-out within three years. The point for you: a sharp customer and product focus comes first, and new channels get added on top of it, not instead of it. You can read the SmartCompany coverage for the full detail.
For your one-page plan, capture three lines in this block:
- Who: the specific buyer (age range, situation, why they buy, what else they buy from).
- Promise: what you do better than the nearest alternative, in one sentence.
- Proof: the two or three facts that make the promise believable (reviews, guarantees, delivery times, materials).
If you are not sure who your best customers are, run a quick pass through your top 100 customers by lifetime value and look for what they share. Our guide to working with an ecommerce consultant covers how outside help can speed this step up, but you can do a first pass yourself in an afternoon.
Step 4: Choose three bets for the next 90 days
Now the part everyone wants to skip to. A bet is a specific change, with an owner, a start date, a measure and a kill rule. Three is the right number for a small team. More than that, and nothing ships properly.
Every bet must pass three tests before it earns a place on the page:
- It attacks the constraint. If it does not move your constraint metric, it is a maintenance task, not a bet.
- You can build it in 30 days. Anything that takes longer gets split into a smaller first bet.
- You can measure it in 90 days. No measure, no bet.
Here is how that plays out when the constraint is retention. A store with a 14% repeat rate might choose: (1) rebuild the post-purchase flow with emails at day 3, 14 and 35, (2) add a checkout bundle on the top three products to lift basket size, and (3) set a free shipping threshold at roughly 25% above current AOV. Each bet has one owner, one number and one end date.
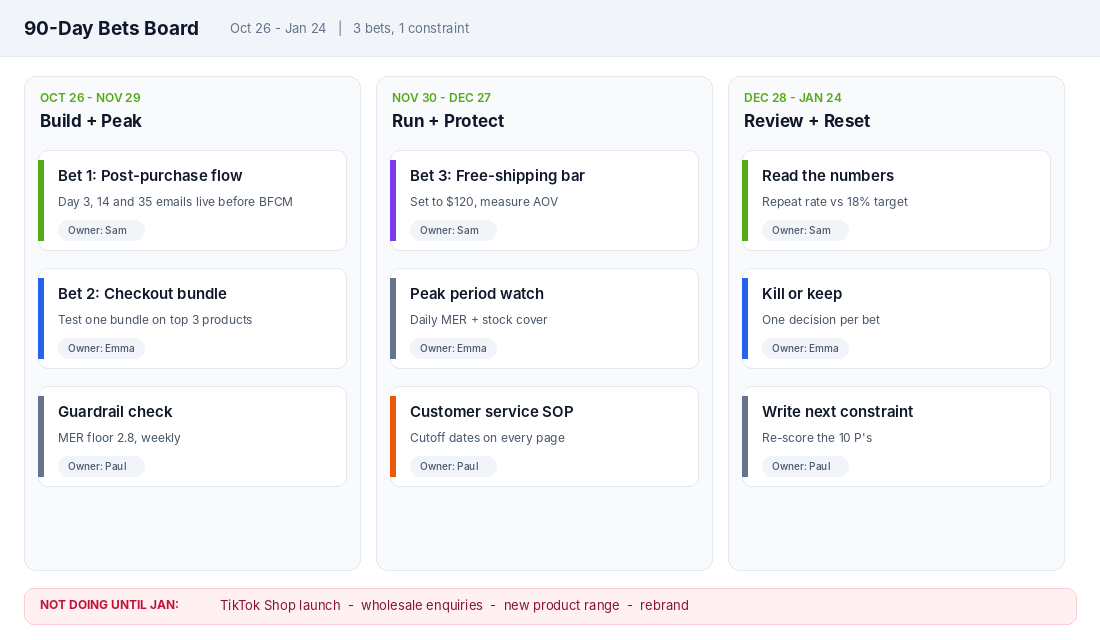
Sequencing matters too. Frank Green, the Melbourne drink bottle brand, is a useful case. Founder Benjamin Young has said the brand wanted to open a retail store two years earlier but could not get orders out fast enough with the growth of the business. Warehouse capacity came first, then stores. Reporting by Realcommercial shows a larger Dandenong South facility now supports its retail expansion. The lesson: your next bet might depend on a constraint you have not looked at yet. Fix the bottleneck, then add the growth.
If you plan quarterly, our 90-day growth sprint guide goes deeper on how to run the sprint itself. For the broader list of growth levers, see how to grow a Shopify store.
Step 5: Write the not-doing list and your guardrails
This is the section most plans leave out, and it is the one that protects the rest. The not-doing list is a written list of good ideas you are parking until the quarter ends. When someone on your team (or you, at 11pm) suggests launching a new range, jumping on TikTok Shop or chasing wholesale, you do not argue. You check the list.
Guardrails are the numeric limits that stop a bet from damaging the business while you test it. Examples we see work well:
- Ad spend capped at a percentage of revenue (for example 24%) while MER stays above the floor.
- A stock cover rule: no promotion on any SKU with fewer than 6 weeks of cover.
- A discount ceiling: no site-wide discount above 20% unless contribution margin per order stays positive.
- A review trigger: if any of the three numbers hits its floor two weeks in a row, the team stops and meets within 48 hours.
In Australian peak season this matters even more. With Black Friday on 27 November 2026 and Cyber Monday on 30 November, a Q4 plan with no guardrails turns into a discounting spree by week two. Write the limits down in October, not in the middle of a sale.
Step 6: Set the weekly and monthly rhythm
A plan that is not reviewed is wallpaper. The rhythm is simple and it takes less time than most meetings you already run.
- Every Monday (15 minutes): update the three numbers, status each bet (on track, at risk, blocked) and name one decision for the week.
- Every month (60 minutes): review the full page against the plan, kill or keep each bet, and check guardrails. Our monthly business review playbook gives you a one-page dashboard for this.
- Day 90 (half a day): re-score the 10 P’s, write the next constraint and build the next page.
Keep the document in one place everyone can see. If it lives in a folder nobody opens, it will not get used.
The tool: build the plan in a Google Sheet (setup in 10 minutes)
You do not need new software. A Google Sheet connected to your Shopify exports does the job, and it is free. Here is the setup.
- Step 1. Create a Google Sheet called “Strategy One-Pager” and add five tabs: Plan, Numbers, Bets, Not Doing, Reviews.
- Step 2. In Shopify admin, go to Analytics, then Reports. Export Sales over time and, if your plan includes it, the customer cohort analysis report. Paste the last 90 days into the Numbers tab.
- Step 3. Add three formulas: repeat rate (customers with 2+ orders divided by total customers), AOV (total sales divided by orders), and MER (total sales divided by total ad and marketing spend).
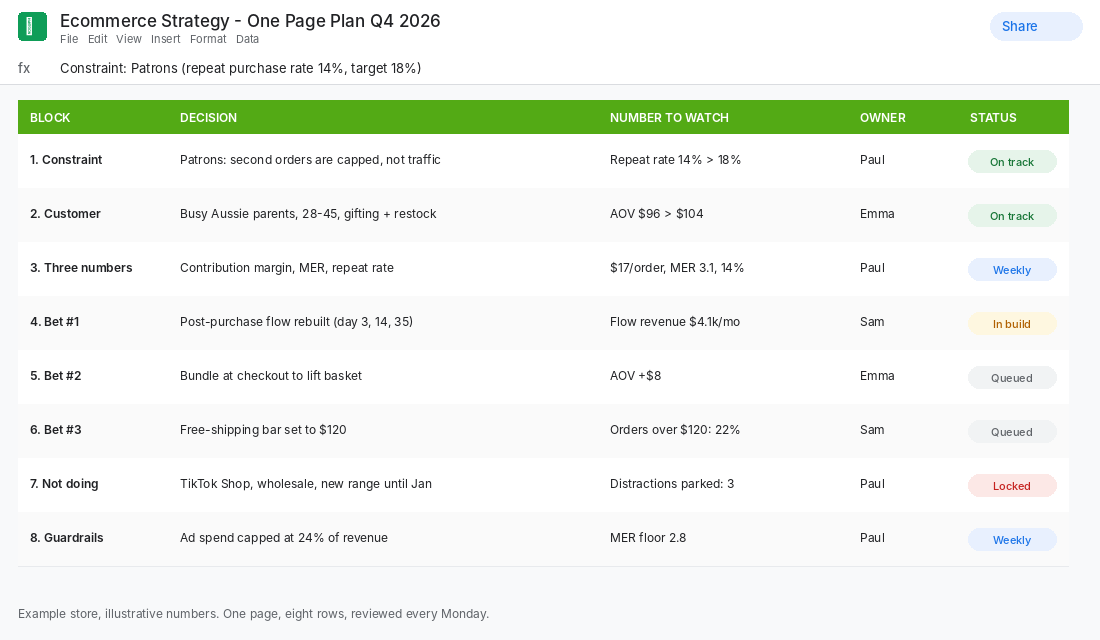
- Step 4. On the Plan tab, list the eight blocks shown in the screenshot below with an owner, a number and a status for each.
- Step 5. Add a recurring Monday calendar reminder titled “Update the one-pager” and link the sheet in the invite.
Shopify’s report availability depends on your plan, so if the cohort report is missing, export your orders as a CSV and calculate repeat rate in the sheet instead. It takes ten minutes.
A worked example: a Shopify store doing 50k a month
To make this concrete, here is an illustrative example (not a client) of a store doing about $50,000 a month. It takes 520 orders at a $96 average order value, which is roughly the national basket size from the Australia Post report.
- Diagnosis: Patrons scores 3 out of 10. Repeat rate is 14%, against a category range of 16 to 21%. Paid traffic is healthy, MER is 3.1, but each new customer is expensive and few come back.
- Customer: busy Aussie parents, 28 to 45, buying for the family and for gifts.
- Three numbers: contribution margin $17 per order, MER 3.1 (floor 2.8), repeat rate 14% with a 90-day target of 18%.
- Bets: rebuild the post-purchase flow, test a checkout bundle, set the free shipping bar at $120.
- Not doing: TikTok Shop, wholesale enquiries, a new range and a rebrand, until January.
- Guardrail: ad spend capped at 24% of revenue, stock cover over 6 weeks on promoted products.
The maths on the prize is simple. If that store lifts repeat rate from 14% to 18% on a base of roughly 400 new customers a month, that is about 16 extra second orders a month, or around $1,500 in revenue, and it compounds as the repeat customers keep buying. Add a $8 lift in AOV across 520 orders, and you have another $4,160 a month. None of it needs a bigger ad budget.
That is what a strategy does. It points a small team at the one place where effort turns into revenue.
Your copy-paste one-page strategy template
The One-Page Ecommerce Strategy
1. Constraint: Our lowest-scoring P is ______ because ______ (number: ______).
2. Customer: We help ______ get ______ without ______. Proof: ______.
3. Three numbers: Contribution margin per order: now ___ / target ___ / floor ___. MER: now ___ / target ___ / floor ___. Constraint metric: now ___ / target ___ / floor ___.
4. Bet 1: ______ | Owner ______ | Done by ______ | Measure ______ | Kill if ______.
5. Bet 2: ______ | Owner ______ | Done by ______ | Measure ______ | Kill if ______.
6. Bet 3: ______ | Owner ______ | Done by ______ | Measure ______ | Kill if ______.
7. Not doing until ______: ______, ______, ______.
8. Guardrails: Ad spend cap ______. Discount ceiling ______. Stock cover rule ______. Review trigger ______.
Rhythm: Monday 15-minute update. Monthly 60-minute review. Day-90 re-score.
Fill it in once, put it in front of your team, and run it for a full quarter before you judge it. The first version will be rough. The third will be sharp.
Why the pieces work as a system
Each block on its own is useful. Together they remove the three things that quietly kill growth in small ecommerce teams: unclear priorities, invisible progress and slow decisions.
The constraint tells you where to aim. The three numbers tell you if you are hitting it. The bets turn the aim into work. The not-doing list protects the work, and the guardrails protect the business while you do it. The rhythm keeps the whole thing honest. Take away any one piece and the plan drifts back into a wish list.
That is also why the page gets better each quarter. When you re-score the 10 P’s at day 90, the old constraint has usually moved, and the next one is sitting right behind it. Retention fixed, now Profit is the lowest. Profit fixed, now Performance. You are not chasing a new idea every month. You are working down a list, in order of impact.
Ecommerce strategy FAQs
How long should an ecommerce strategy be?
One page. If you need more room, you are probably carrying too many bets or too many numbers. Cut until it fits.
How often should I update my ecommerce strategy?
Review it weekly for 15 minutes and rewrite it every quarter. A full annual strategy is useful for direction, but a 90-day page is what changes behaviour.
What is the difference between an ecommerce strategy and a business plan?
A business plan describes the whole company for lenders, partners or investors. A strategy is the short list of choices about where you will focus this quarter and what you will not do.
Do I need a consultant to build one?
No. You can complete the first version yourself using the template above. A coach or consultant helps most with diagnosing the constraint honestly, because founders are usually too close to their own store.
Next step
Inside eCommerce Circle, strategy is one of the core pillars we work on with every member, because a clear plan makes every other piece of the business easier. If you want to see exactly where your store is being capped, take the free More Orders Scorecard. It takes two minutes and shows you which of the 10 P’s to fix first.