To grow a Shopify store, pull four levers in this order: fix your conversion rate, lift your average order value, win the second order with email, and only then buy more traffic. Most founders do it backwards. They spend more on ads while a leaky store quietly burns the extra visitors.
What’s in This Article
Here is the pattern we see inside eCommerce Circle every month. A store doing $40k to $70k a month decides it needs “more traffic.” Ad spend goes up, sessions go up, and revenue barely moves because the store converts at 1.2% and 70% of carts are abandoned. The founder concludes ads do not work. The ads were fine. The store was the bottleneck.
This guide gives you the five levers in the order that pays back fastest, the exact maths behind each one, the Australian benchmarks to measure yourself against, and a 30-day plan you can start this week.
The growth equation every Shopify store runs on
Every dollar your store makes comes from one equation: revenue = sessions x conversion rate x average order value. Repeat customers feed it by raising how many of those orders come from people you already paid to acquire. That is the whole game. There is no secret fifth variable.
Let’s put numbers on it. Take a store with 40,000 sessions a month, a 1.8% conversion rate and a $96 average order value. That is 720 orders and $69,120 a month. Now watch what each lever does on its own.
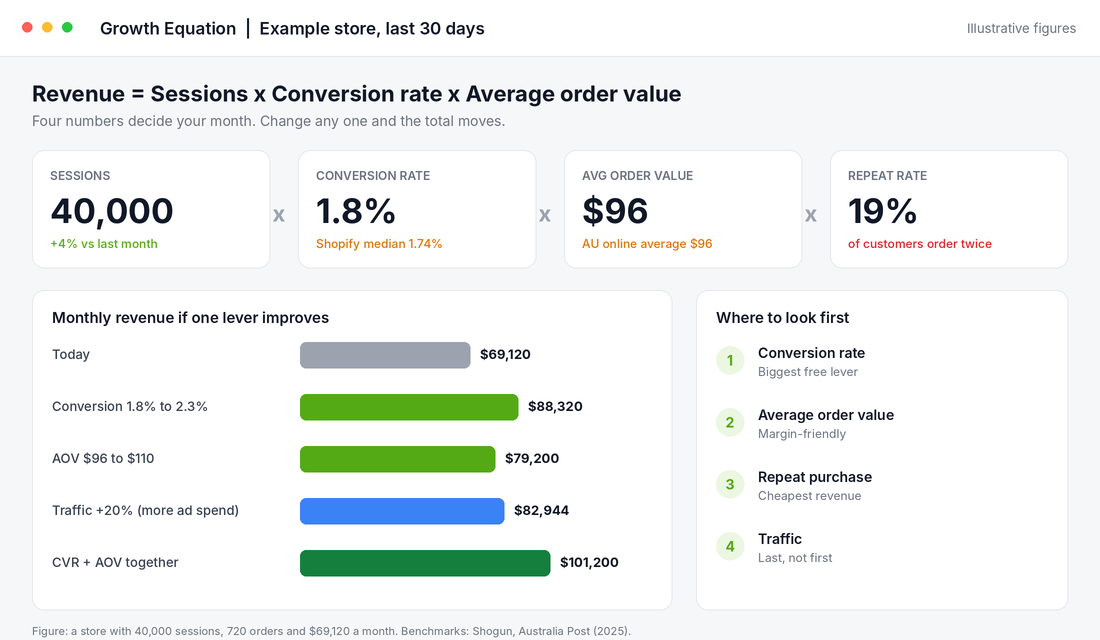
- Conversion rate from 1.8% to 2.3%: 920 orders, $88,320 a month. That is +$19,200 with zero extra ad spend.
- AOV from $96 to $110: $79,200 a month. +$10,080, and almost all of it is margin because you already paid for the customer.
- Traffic up 20%: $82,944 a month. +$13,824, but you paid for every extra session.
- Conversion and AOV together: 920 orders at $110 is $101,200 a month. That is 46% more revenue from the same 40,000 visitors.
Look at that last line. Same traffic. Same ad budget. Nearly half again as much revenue. That is why we sequence the levers this way, and why the rest of this article starts inside your store, not in your ad account.
The market backs the effort. Australians spent $82.6 billion online in 2025, up 14% on the year, according to Australia Post’s annual e-commerce report as covered by Inside Retail. The average household now buys from around 16 brands a year. Demand is growing. The question is whether your store captures its share of it.
Lever 1: Know your numbers before you change anything
You cannot pull a lever you cannot see. Before you touch your theme, your ads or your emails, set up one page that shows four numbers every Monday: sessions, conversion rate, average order value and repeat customer rate. That is your Performance dashboard in the 10 P’s, and it is the cheapest hour you will spend all month.
Pull the numbers from Shopify’s own Analytics for orders and AOV, and from GA4 for traffic sources if you have it set up properly (our guide to trusting your GA4 data covers the traps). Put them in a simple sheet with a column per week. After four weeks you will see patterns that no single dashboard snapshot shows.
Then compare yourself to something real. Shogun analysed 745 Shopify stores between January and June 2026 and found a 2.61% mean conversion rate but a 1.74% median. The gap matters. A few very strong stores drag the average up, so the median is the fairer yardstick. The top quartile starts at 3.39%. If you sit at 1.8%, you are average, not broken. If you sit under 1%, something specific is wrong and you will find it in Lever 2.
| Metric | Typical | Strong | Source |
|---|---|---|---|
| Conversion rate (Shopify) | 1.74% median | 3.39%+ (top 25%) | Shogun, 745 stores, H1 2026 |
| Product page add-to-cart rate | 6.08% | Beauty 9.56% | Dynamic Yield, rolling 12 months |
| Average order value (AU online) | $96 | Varies by vertical | Australia Post, 2025 |
| Cart abandonment | 70.22% | Under 65% | Baymard, 50 studies |
We cover the full benchmark picture in our Shopify conversion rate benchmarks article. For now, write your four numbers down. That is Friday’s job for week one.
Lever 2: Fix the leaks in your conversion rate
Conversion is the biggest free lever because the visitors are already there. You are not buying anything. You are removing reasons not to buy.
Start with where people drop off. Open the funnel report in Shopify Analytics and look at the step-to-step percentages: sessions to product view, product view to add to cart, cart to checkout, checkout to order. One of those will be clearly worse than the others.
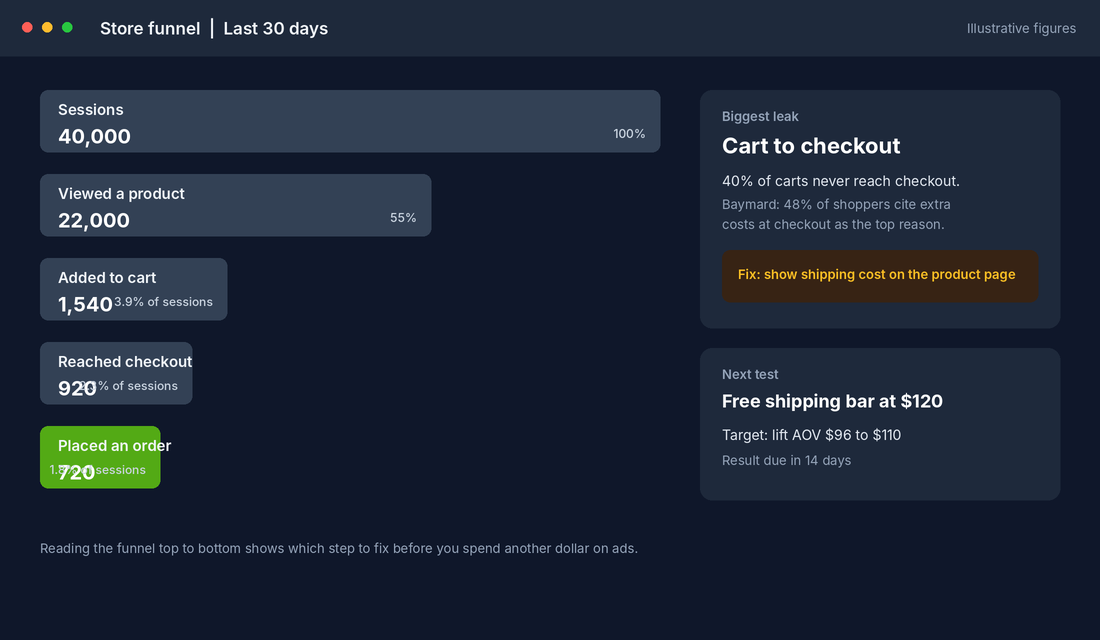
Here is how to read it, and what to do about each leak.
- Weak sessions to product view: your traffic is wrong or your collection pages do not sell. Check your ad targeting and your first screen on mobile.
- Weak product view to add to cart (under 5%): the product page is the problem. Photos, price framing, reviews, shipping clarity. Our product page framework walks through every element.
- Weak cart to checkout: surprise costs. Baymard’s research found 48% of shoppers abandon because extra costs such as shipping or fees were too high, the single biggest reason. Show shipping costs or a free shipping threshold on the product page and in the cart drawer.
- Weak checkout to order: trust and friction. 26% of shoppers in the same Baymard study left because the site forced account creation. Turn on guest checkout and offer Shop Pay and the wallet options Australians use.
Tool: Microsoft Clarity (free) for session recordings
Numbers tell you where people leave. Recordings tell you why. Microsoft Clarity is free, has no traffic cap on its standard plan, and installs in about ten minutes. Here is the setup:
- Create a free project at clarity.microsoft.com and name it after your store.
- Install it on Shopify. Either add the Microsoft Clarity app from the Shopify App Store, or paste the tracking snippet into your theme’s
theme.liquidjust before the closing head tag. - Wait a few hours for data to collect, then open Recordings and filter by device: Mobile, and by page: your top product page.
- Watch 30 recordings. Take notes only on repeated behaviour: rage clicks, people scrolling past the add-to-cart button, people opening the size chart and leaving.
- Fix the top three repeated problems, one at a time, and log the date so you can compare conversion before and after.
Thirty recordings usually shows you more than any survey. Pair this with our Shopify CRO audit checklist if you want a structured pass through the whole store. And if you want the full method, start with the conversion rate optimisation guide.
Lever 3: Lift your average order value without discounting
Once more of your visitors convert, make each order worth more. AOV is the most margin-friendly lever because you have already paid to acquire the customer. An extra $14 on the basket costs you almost nothing in acquisition.
Know your starting point. Australia Post puts the national average online basket at $96. By vertical, the spread is wide: Adore Beauty reported an AOV of $114.20 in FY24, up from $102.30 in FY21, a rise of roughly 12% over three years. Temple & Webster’s implied order value sits around $265 because homewares baskets are bigger by nature. Compare yourself to your vertical, not the national figure.
Four tactics move AOV reliably:
- A free shipping threshold. The rule of thumb is your median basket plus 30 to 40%. If your median order is $70, set free shipping at $95 to $100. Display a progress bar in the cart so customers see how close they are.
- Bundles built from what already sells together. Open your orders, find the pairs that appear together most often, and offer them at a small saving. Do not invent bundles nobody asked for.
- Post-purchase upsell. One relevant add-on offered after the payment step, with one click to accept. No new checkout, no new friction.
- Tiered value. Show a 2-pack and 3-pack with the per-unit saving. Consumables and beauty respond especially well.
Frank Green is a useful Australian example of value through product design rather than price cuts. The brand built a cult following around one hero product, the chrome bottle, offers colour and monogram personalisation online, and in February 2025 opened its first standalone store at Chadstone with a display of more than 1,600 chrome bottles. Personalisation and a hero product lift what customers are willing to pay. That is an AOV strategy before it is a branding one.
Run one AOV test at a time and give it 14 days. Our split testing guide explains how to read the result without fooling yourself.
Lever 4: Win the second order with email
Here is the line that changes how founders think about growth: a returning customer costs you a fraction of a new one. Acquisition cost is the biggest line in most stores’ marketing budget, and the second order skips it entirely.
Email is how you get it. Omnisend’s 2025 e-commerce report found that automated emails produced 37% of all email-generated sales while making up only 2% of email volume. Klaviyo’s 2026 benchmarks put average revenue per recipient at $6.77 for abandoned cart flows and $5.75 for welcome flows, with the top 10% of stores reaching $13.70 and $13.27. Flows are the most under-built asset in most Shopify stores.
Build in this order:
- Abandoned cart (3 emails): send the first within an hour. Barilliance data shows emails sent inside an hour convert at 20.3%, against 12.2% after 24 hours. Follow at 24 and 72 hours. See our abandoned cart flow architecture for the full sequence.
- Welcome series (4 to 5 emails): introduce the brand, answer the top objections, show best sellers, and make the second-purchase offer. Our welcome flow guide has the structure.
- Post-purchase flow: order confirmation, delivery update, a how-to-use email, a review request, then a replenishment or cross-sell at the right day.
- Win-back: customers who have not ordered in two to three times your normal repurchase window. Use our win-back flow as the template.
Set a target. If 19% of your customers currently order twice, aim for 22% in 90 days. On a store with 720 orders a month, that is the difference between constantly hunting for new buyers and a baseline of orders that arrive without ad spend.
Lever 5: Scale traffic last, with a margin guardrail
Now, and only now, you buy more visitors. By this point your store converts better, each order is worth more, and customers come back. Every extra dollar of ad spend works harder, so you can afford to bid more than competitors who skipped the first four levers.
Put a guardrail on spend so growth does not eat your profit. Work out your break-even ROAS from your contribution margin (revenue minus product cost, shipping, fees and returns) and never scale a campaign that sits below it for more than two weeks. Our post on contribution margin shows the calculation.
Then raise budgets in measured steps. A 20% increase every few days keeps most campaigns stable, while a doubling overnight often pushes them back into a learning phase. Our Meta ads budget guide explains how much a Shopify store should spend at each revenue stage.
One more point on channels. Diversify slowly. Get one paid channel profitable before adding a second, and use email and SEO to carry the customers you already have. A store that depends on one ad platform for all its orders is one policy change away from a bad month.
How the five levers compound
The levers are not separate projects. They multiply. A higher conversion rate means every visitor from every channel is worth more. A higher AOV means each of those orders carries more margin. Email brings a share of those customers back, so your acquisition cost is spread across more than one order. And a clear dashboard tells you which lever has slipped before it shows up in the bank balance.
Run the numbers again with our example store. Conversion goes from 1.8% to 2.3% and AOV from $96 to $110, which gives $101,200 a month from the same traffic. Lift repeat rate from 19% to 22% and a meaningful share of those orders arrive without ad spend at all. Then add 20% more traffic on top and you are above $120,000 a month from a store that was doing $69,000 when you started. No single move did that. Four small, boring improvements did.
This is also why we treat growth as a system in the More Orders Operating System. The 10 P’s cover Product, Prospects, Profit, Patrons, Promotion, Platform, Performance, People, Protection and Practice. Weakness in any one of them caps the others. If you want help running that system, eCommerce Circle coaching is how we work with founders directly, and our guide to ecommerce coaching in Australia explains what to expect.
Your 30-day Shopify growth plan
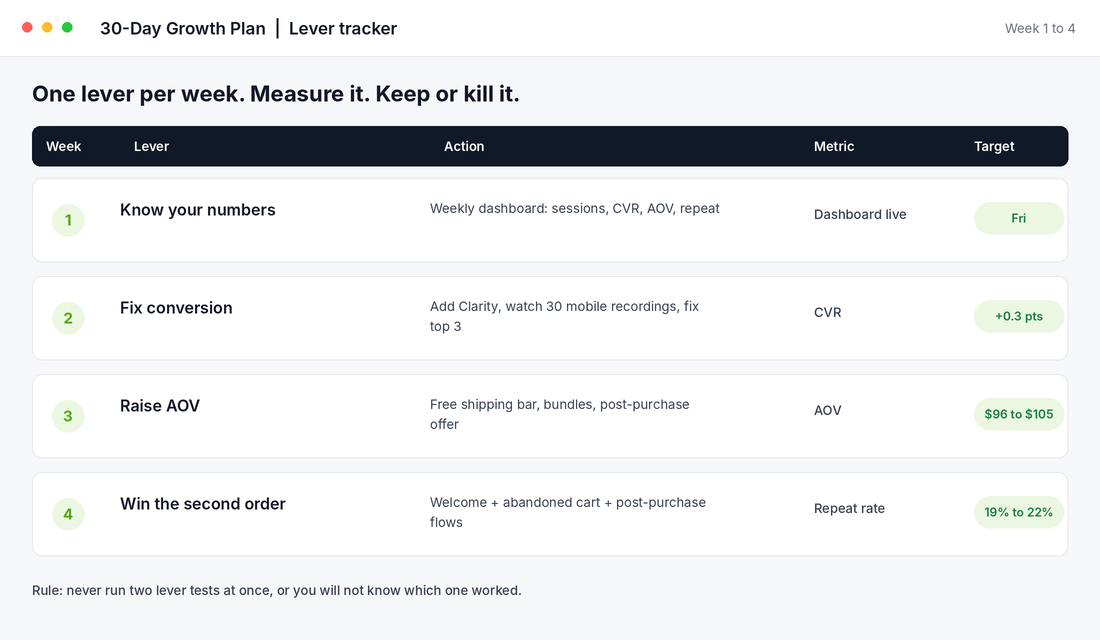
Here is the checklist. Copy it into your task manager and tick it off.
Week 1: Know your numbers
- Build a four-number weekly dashboard: sessions, conversion rate, AOV, repeat rate.
- Record your last 8 weeks of each figure as a baseline.
- Compare conversion and AOV to the benchmarks above and write down your gap.
Week 2: Fix conversion
- Install Microsoft Clarity and watch 30 mobile recordings.
- Read the Shopify funnel report and find your biggest drop-off.
- Fix the top three issues, one at a time, logging the date of each change.
Week 3: Raise AOV
- Set a free shipping threshold at your median basket plus 30 to 40%.
- Build one bundle from your most common product pairs.
- Add a post-purchase offer and track its take rate.
Week 4: Win the second order
- Check your abandoned cart, welcome and post-purchase flows are live and sending.
- Add a win-back flow for customers past their normal repurchase window.
- Set a repeat rate target for the next 90 days.
At the end of week four, review all four numbers against your baseline. Keep what moved the needle. Cut what did not. If you want to go further, our 90-day growth sprint guide turns this into a quarterly plan.
The mistake to avoid is running everything at once. Change one lever per week. If you change the shipping threshold, the product page and the welcome flow in the same week, you will not know which one worked.
Where to start today
Open Shopify Analytics, write down your conversion rate and average order value, and compare them to the table earlier in this guide. Whichever is furthest below benchmark is your first lever. Fix that before you spend another dollar on traffic.
Inside eCommerce Circle, growth sequencing is one of the core pillars we work on with every member. If you want to see exactly where your store is being capped, take the free More Orders Scorecard. It takes two minutes and shows you which of the 10 P’s to fix first.
Sources
- Inside Retail: Australia Post year in e-commerce, March 2026
- Blend Commerce: 2026 conversion rate benchmarks (Shogun, Dynamic Yield, IRP Commerce)
- Ringly: cart abandonment statistics 2026 (Baymard Institute, Barilliance)
- PushOwl: email marketing statistics 2026 (Klaviyo, Omnisend)
- EightX: Australian ecommerce AOV by vertical
- SmartCompany: Frank Green first physical store