Your repeat customer rate is the percentage of your customers who buy from you more than once in a set period. Most Shopify stores land between 20% and 30%, and consumable categories often run higher. If you are under 20%, you are paying to acquire the same customer again and again.
What’s in This Article
Here is the part most founders miss. They chase a bigger ad budget while a leaking second-order rate quietly caps their profit. One widely cited data set from Gorgias, reported by Opensend, found repeat customers made up only 21% of customers yet drove 44% of revenue and 46% of orders. A small slice of your list is doing nearly half the work.
This guide gives you the formula, the benchmarks by category, a clean way to pull your own number out of Shopify, and the six fixes we use with stores inside eCommerce Circle to lift it. It sits alongside our deeper pieces on the repeat purchase system and why the second sale matters more than the first. Read this one first to find your number, then go deeper where you are weakest.
How to Calculate Repeat Customer Rate (and the Version Shopify Shows You)
The standard formula is simple: customers who placed two or more orders, divided by total unique customers, multiplied by 100. If 1,200 of your 5,000 customers in the last 12 months bought more than once, your repeat customer rate is 24%.
Shopify’s own analytics uses a slightly different measure. Shopify staff describe the returning customer rate as returning customers divided by returning plus first-time customers for the period you are viewing. That is a share of this period’s buyers, not a share of your whole customer base who ever came back. Both are useful. They are not the same number, so never compare one against the other.
- Repeat customer rate (cohort view): of everyone who first bought in a window, how many bought again. This is the number to track for retention health.
- Returning customer rate (period view): of everyone who ordered this month, how many had ordered before. This moves with your ad spend, because new customer surges push it down.
- Repeat share of revenue: the percentage of revenue from customers on their second order or later. This is the one that tells you whether retention is paying the bills.
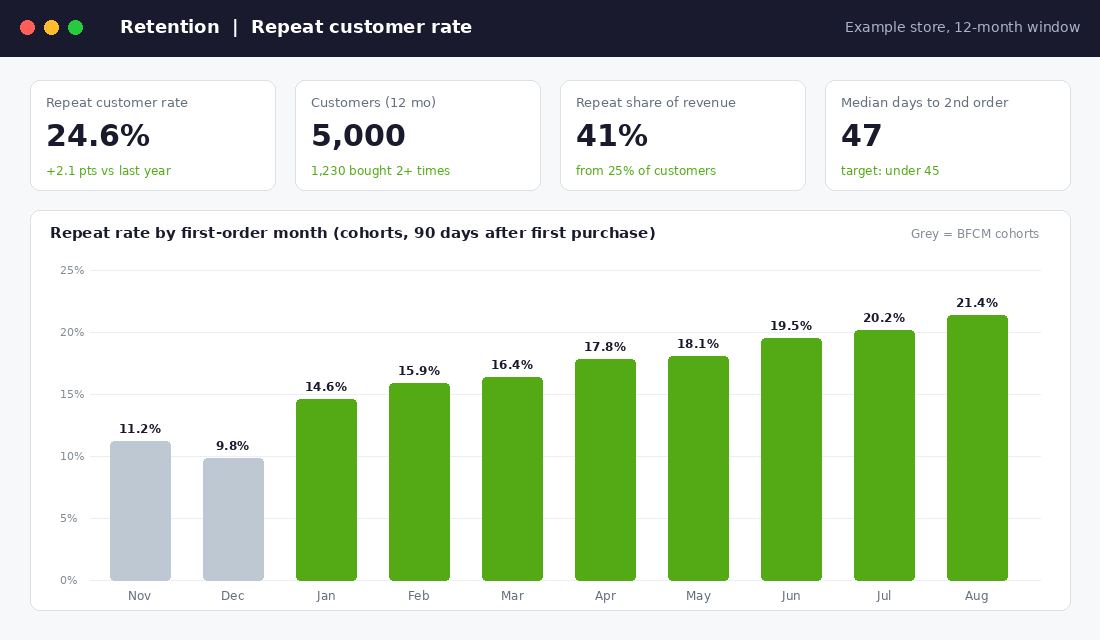
Pick one definition and one window and stick with it. A 90-day cohort window is the best starting point for most stores because it shows you whether your post-purchase work is landing within a useful time. For consumables with long buying cycles, use 180 days. Mixing windows month to month is how founders convince themselves things are improving when they are not.
What Is a Good Repeat Customer Rate? Benchmarks by Category
Treat every benchmark in this space with some suspicion. The sources define repeat rate differently, use different time windows, and several are published by retention software vendors with a reason to make the problem look big. With that said, the ranges are consistent enough to be useful.
- Cross-category average: about 28.2% in the most-cited figure, though another 2026 roundup puts the typical range at 15% to 30%.
- CBD products: 36.2%, the highest reported ecommerce category.
- Pet supplies: 30% or more, higher again with subscriptions.
- Health and supplements: around 29%.
- Beauty and cosmetics: around 25.9%.
- Fashion and apparel: roughly 24% to 26%.
- Electronics: around 18%.
- Luxury goods: 9.9%.
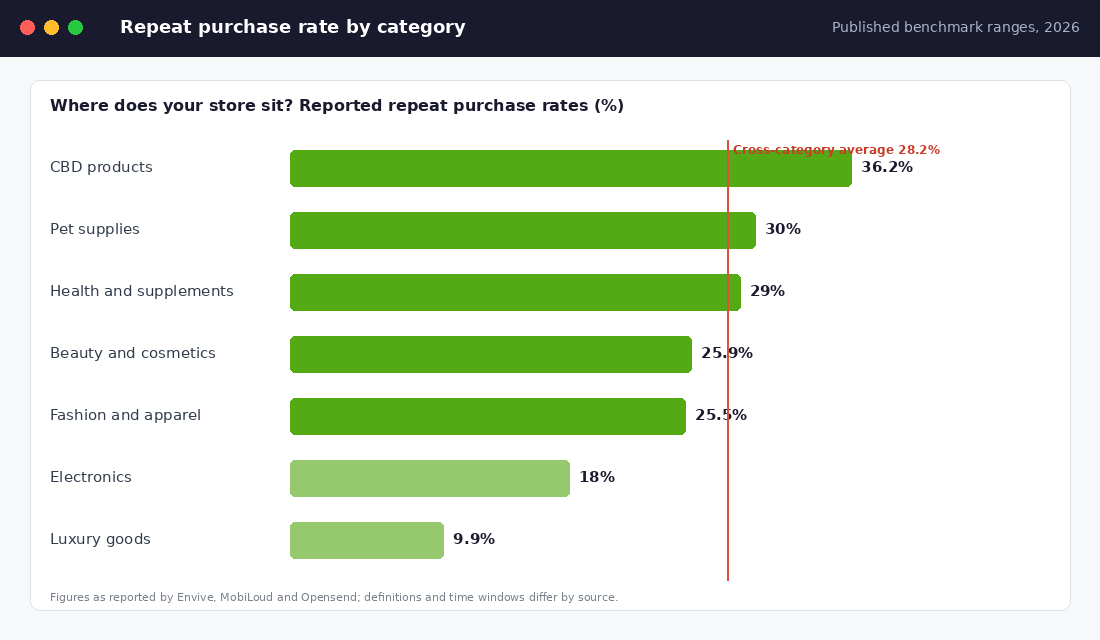
The category figures come from Envive, MobiLoud and Opensend, as compiled in 2026 roundups by Rivo and Opensend. You will also see grocery quoted at 65.2%, but that is repeat purchase intent, not observed behaviour, so ignore it.
What matters is the gap between you and your own category, not the cross-category average. A skincare brand at 20% has a real problem. A furniture store at 20% is doing very well. Match your product’s natural buying cycle first: if customers should reorder every 60 days and you only send them a message at day 120, your rate will be low for reasons that have nothing to do with product quality.
A rough Aussie rule of thumb we use when coaching: under 15% means acquisition is masking a retention problem, 15% to 25% is average and fixable, 25% to 35% is healthy for most categories, and above 35% means you should be putting real money into your best customers rather than hunting for more of them.
Why Repeat Customer Rate Moves Your Profit More Than Your Ads
Selling to an existing customer is far cheaper than finding a new one. A Rivo compilation puts the probability of selling to an existing customer at 60% to 70%, against 5% to 20% for a new prospect. Treat those numbers as directional, since they come from vendor content, but the direction is not in dispute.
Run your own numbers. Say your blended customer acquisition cost is $38 and your average first order gives you $26 of contribution margin after product, shipping and fees. You are $12 underwater on every new customer and you only get paid back on the second order. Now lift your repeat rate from 20% to 28% on a base of 5,000 customers a year. That is 400 extra repeat buyers. At even $30 of contribution margin on that second order, you have added $12,000 of profit without spending an extra dollar on ads.
Another benchmark from MobiLoud, reported by Opensend, says stores with a 40% repeat customer rate generate about 50% more revenue than stores with a 10% rate. Whether or not that exact figure holds for you, the logic does. Profit lives in the second, third and fourth order.
This is also why we push stores to check contribution margin per cohort, not just blended ROAS. Our post-peak retention guide covers what to do with the Black Friday buyers you are about to acquire at a thin margin, which matters a lot in the next five weeks.
Step 1: Pull Your Real Repeat Customer Rate From Shopify
You do not need a paid app to find your baseline. Do this once, then repeat it every quarter.
- Choose your window. Use the last 12 months of first-time customers, and measure repeat purchases within 90 days of their first order.
- Export your orders. In Shopify admin, go to Orders, export all orders for the period, and open the CSV in Google Sheets. You need customer email, order name, created date and financial status.
- Clean the data. Remove cancelled and fully refunded orders. Remove draft and wholesale orders if you sell B2B, because they distort the result.
- Count orders per customer. Use a pivot table with email as the row and a count of order names as the value. Customers with a count of 2 or more are repeat customers.
- Apply the formula. Repeat customers divided by total unique customers, times 100.
- Cross-check inside Shopify. In Analytics, look for the returning customer rate and customer cohort reports. Which ones appear depends on your plan, so check what your admin offers rather than assuming. Expect the figures to differ from your sheet because of the definitions above.
Be careful with subscriptions. A Shopify community thread on this exact metric shows merchants unsure whether repurchases processed through a subscription app count as returning customers. Check your own data: if your subscription orders are coming through under a different email or as a separate customer record, your repeat rate will look worse than it is.
Then split the number three ways before you do anything else. First, by acquisition channel, because Meta prospecting buyers and email-subscriber buyers repeat at very different rates. Second, by first product purchased, because some hero products create loyal customers and others create one-time bargain hunters. Third, by whether the first order used a discount code. That last split alone usually surprises people.
Step 2: Find the Leak Using the Second-Order Window
Most stores lose the second order in the first 60 days, not later. The question to answer is simple: how many days pass between first and second order for the customers who do come back? Take the median.
If your median is 47 days, as in the example dashboard above, your post-purchase messages need to land well before day 47. A flow that fires on day 90 is chasing people who have already moved on. That is the single most common timing mistake we see.
Now check the people who did not come back. If you sell something with a natural usage life, such as skincare, coffee, supplements or pet food, work out when a typical customer runs out. Take the pack size, divide by normal daily use, and add shipping time. That number is your replenishment trigger, and it beats any generic ‘we miss you’ timer.
For non-consumables, the trigger is different. It is the moment of peak satisfaction: when the product has been used successfully once. For a backpack, that is not day 3, it is after the first trip. Ask yourself what ‘first success’ looks like for your product, then build your message around it.
Step 3: Build the Post-Purchase Sequence (Klaviyo Setup)
Klaviyo is our usual recommendation for Shopify stores that want deeper segmentation, and it has a Shopify integration that syncs orders and products. Omnisend and Shopify Email can handle a simpler version of the same sequence. Whichever you use, the structure matters more than the tool.
Here is a six-message sequence you can build in an afternoon. It is the same architecture you can see in the example flow below.
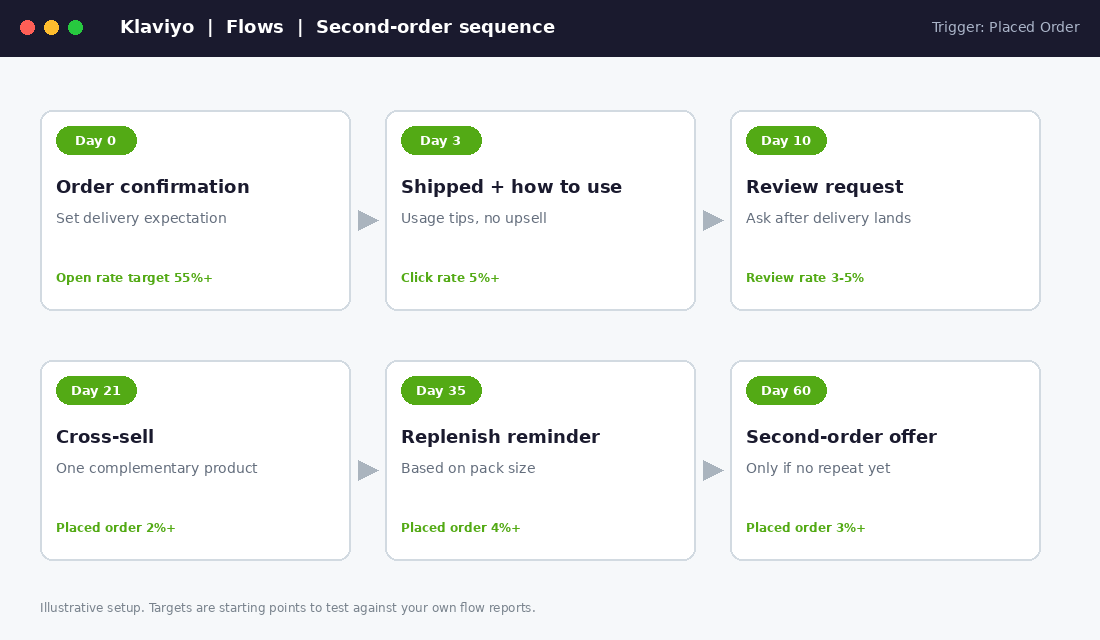
- Day 0, order confirmation. Set expectations on delivery. Australia Post timing questions are the biggest source of post-purchase anxiety, so be specific about dispatch and delivery windows.
- Day 3, shipped and how to use it. Send usage tips and a short video. No upsell here. You are building the success moment.
- Day 10, review request. Ask once the product has arrived and been used. Reviews help the next buyer, and a customer who has left a review is more invested.
- Day 21, one cross-sell. Recommend a single complementary product, based on what they bought. One product converts better than a grid of six.
- Day 35, replenishment reminder. Timed to your run-out calculation from Step 2. Make reordering a single click where you can.
- Day 60, second-order incentive. Only for customers who have not repeat purchased. Keep it modest and use it as a last step, not a default.
To set it up in Klaviyo: go to Flows, create from scratch, and choose Placed Order as the trigger. Add a flow filter to exclude customers who already have two or more orders, so repeat buyers do not get the new-customer sequence. Use time delays between messages, and add conditional splits by product category so the cross-sell and replenishment messages match what they actually bought.
Then check the flow report after 30 days. Look at placed order rate per message and revenue per recipient. Cut the message that earns nothing and put your effort into the one that earns the most. Our win-back flow guide covers what to do for the customers who stay silent after the sequence ends.
Step 4: Fix the Promise Between Ad and Parcel
Retention starts before the first purchase. The customers who repeat are the ones whose first experience matched what the ad and product page promised. If your Meta creative sells a result your product does not reliably deliver, you will see strong first-order numbers and a weak repeat rate.
Run a simple test. Read your last 50 one-to-three star reviews and your customer service inbox, and tag each complaint as product, expectation, delivery or service. If ‘expectation’ leads the list, your repeat rate problem is a marketing and product-page problem, not an email problem. No flow will fix it.
Delivery is the usual second culprit. A parcel that arrives late with no communication kills the second order faster than almost anything. Tell customers when it ships, give them a real tracking link, and proactively email if a parcel is delayed.
Step 5: Use Subscriptions and Replenishment Where They Fit
Subscriptions are the cleanest way to lift repeat rate in categories with predictable usage. Who Gives A Crap is the Australian example everyone points to: it chose a product people always need, built its growth around subscriptions, and keeps customers engaged through changing designs, limited-edition wrappers and a visible giving story. Forbes Australia’s brand-partner feature on the company reports AU$11,222,000 donated so far. That is the company’s own framing, not independent data, and the piece does not publish a repeat rate.
The lesson is not ‘start a subscription’. It is that the brand made reordering feel like part of an identity, not a transaction. If your product is not a consumable, a subscription will frustrate customers. Use a replenishment reminder, a membership, or a refill programme instead.
- Consumables: offer subscribe-and-save with easy skip, pause and swap. The flexibility matters more than the discount.
- Semi-durable products: use usage-based reminders such as ‘time to restock’ or ‘time to replace’ with a clear trigger.
- Durable goods: focus on cross-sell and accessories. Your repeat rate will be lower, and that is fine if the average order value is high.
Quiz-led personalisation is another repeat driver worth knowing about. Web Profits, an Australian agency, reports that The Beauty Chef lifted revenue per recipient on its quiz flow from $1.65 to $4.51. That is the agency’s own claim, so treat it as a case to test, not a guarantee. The idea is sound: when a customer tells you what they need, you can send a relevant second-order message.
Step 6: Reward the Customers Who Already Love You
Loyalty programs work best on customers who were already likely to come back, and they reward you for that. A Rivo compilation reports customers who redeem loyalty points repeat at 50%, against 10.7% for non-redeemers. Be careful reading that: redeemers were probably more engaged to start with. Still, the redemption step creates a reason to return, which is the point.
For most Australian stores under $5M a year, a heavy points program is overkill. Start smaller:
- Early access: let your top 20% of customers shop new drops or sales 24 hours early. It costs nothing and makes them feel noticed.
- A thank-you at order three: a handwritten note or small gift at the third order tells customers you see the relationship.
- Referral rewards: your repeat customers are your best source of new ones. Give them a simple code to share.
- VIP segment in Klaviyo: tag customers with three or more orders or a high lifetime spend, and exclude them from discount-heavy sends. They do not need a 30% coupon.
One more Australian note. A Shopify Plus and YouGov study quoted in that Forbes piece found only 36% of Australians call themselves brand-loyal shoppers, while 90% say their loyalty can be bought with discounts, rewards and members-only experiences. Read that as an opportunity: loyalty here is earned by offers and experience, not guaranteed by brand affection. That is why the value of an owned relationship is so high.
The Compound Effect: How the Six Fixes Stack
None of these fixes is dramatic alone. A better delivery message might lift repeat purchase by half a point. A replenishment reminder might add a point or two. A well-timed cross-sell adds another point. Segmenting your VIPs from discount sends protects margin.
Stack them across 5,000 customers a year and the maths shifts. Moving from 20% to 28% is 400 extra repeat buyers. Each one that goes on to a third order is cheaper again, because you already hold their email, their preferences and their trust. Bain & Company’s often-quoted finding, which appears in several retention guides, is that a 5% lift in retention can raise profit by 25% or more. The exact figure varies by industry, but the compounding is real.
And the effect compounds on your ad spend too. When your lifetime value rises, you can afford a higher acquisition cost than your competitors, which lets you win auctions they cannot. Retention is a quiet way to improve paid media performance without touching the ad account.
Your 30-Day Repeat Customer Rate Checklist
Copy this into your project tool and work through it in order.
- Export 12 months of orders and calculate your 90-day repeat customer rate.
- Split the number by channel, hero product and discount-versus-full-price first orders.
- Calculate your median days between first and second order.
- Calculate your product’s real run-out date for consumables, or its first-success moment for everything else.
- Build or rebuild the six-message post-purchase flow in Klaviyo, with the repeat-buyer exclusion filter.
- Read your last 50 low reviews and tag each as product, expectation, delivery or service.
- Fix the biggest tag first, whether that is a product page, a shipping message or a product issue.
- Create a VIP segment and exclude it from blanket discount sends.
- Review flow revenue per recipient at day 30 and cut the weakest message.
- Re-measure your repeat rate in 90 days using the same definition and window.
Write down your baseline today. Without it, you cannot tell which fix worked.
What to Do Next
Repeat customer rate is one of those numbers that rewards the founder who looks at it every quarter. Inside eCommerce Circle, retention is one of the core pillars we work on with every member, and it sits in the Patrons section of the More Orders Operating System. If you want to see exactly where your store is being capped, take the free More Orders Scorecard. It takes two minutes and shows you which of the 10 P’s to fix first.