You spent $42 to send a paid-traffic visitor to a product page that says “sold out”. They tap back, you eat the click, and 91% of them will not return when the product is back. That is the silent tax most Aussie Shopify stores pay every single month, and the worst part is the customer was ready to buy.
What’s in This Article
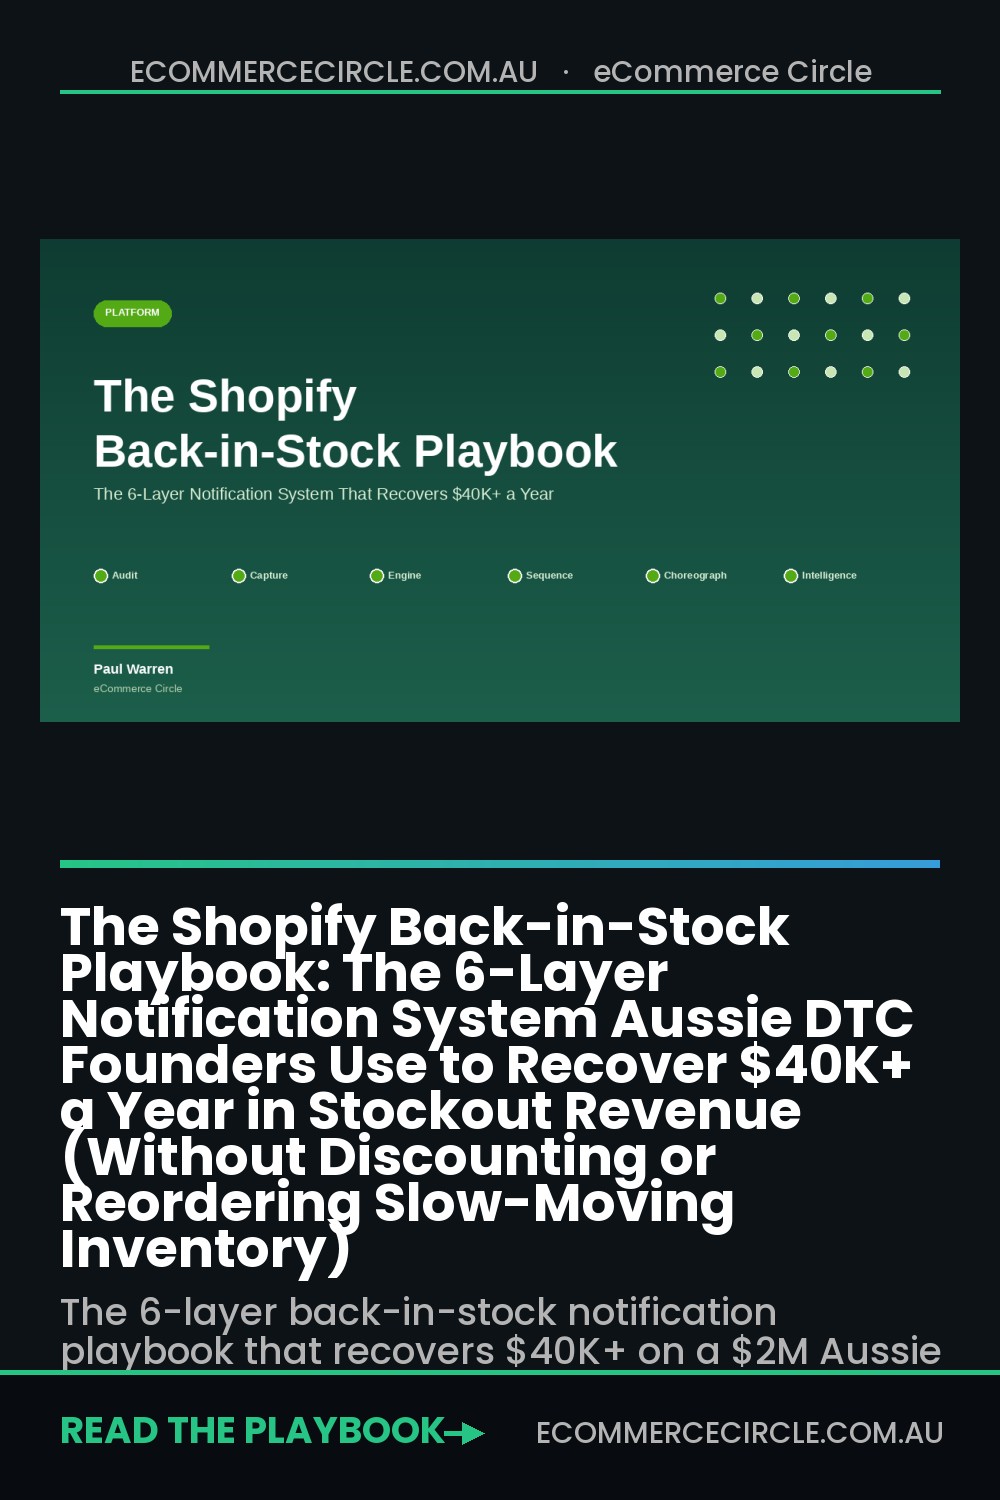
The fix is not faster reorders. It is a back-in-stock notification system that turns that lost click into a captured intent signal, then converts that signal at 25 to 35% the moment stock lands. Klaviyo and Omnisend both report back-in-stock automations hit 58% open rates, 21% click rates, and 30.5% click-to-conversion (5 to 10x stronger than a standard campaign). Gartner now ranks back-in-stock alerts the third most profitable email automation behind cart abandonment and post-purchase, with a 342% median Year 1 ROI.
The catch is that most stores either skip the mechanic entirely, hide a tiny “notify me” text link under the variant picker, or send the restock email three hours late through their generic marketing queue. By then the bestselling size is gone again, and the customer learned not to trust your alerts. Below is the 6-layer playbook we run with Aussie DTC founders inside the workshop. It typically recovers $40K+ a year on a $2M brand, with zero discounting and no extra ad spend.
Layer 1: Audit the Bleed (Find Out How Much Stockouts Are Actually Costing You)
You cannot defend revenue you are not measuring. Before you install an app or rewrite a single button, calculate your real stockout cost. Most founders dramatically underestimate it. Industry data puts the typical ecommerce out-of-stock rate at 2 to 5% under normal conditions and 8 to 10% during promotions. Products that go OOS stay unavailable for an average of 35 days. Once you factor in CLV loss, paid-traffic waste, and SEO ranking damage, a single stockout event costs 1.5 to 3x the direct lost revenue.
Pull a Shopify Analytics export of Sessions by landing page for the last 90 days, filter to PDPs, then cross-reference your inventory log for the periods each SKU was at zero. Apply this formula per SKU:
- OOS lost revenue = (OOS hours / total hours) × sessions × site CR × AOV
- True cost = OOS lost revenue × 2.0 (mid-point of the 1.5 to 3x multiplier)
- Recoverable share = true cost × 0.20 (the share a back-in-stock flow typically recaptures)
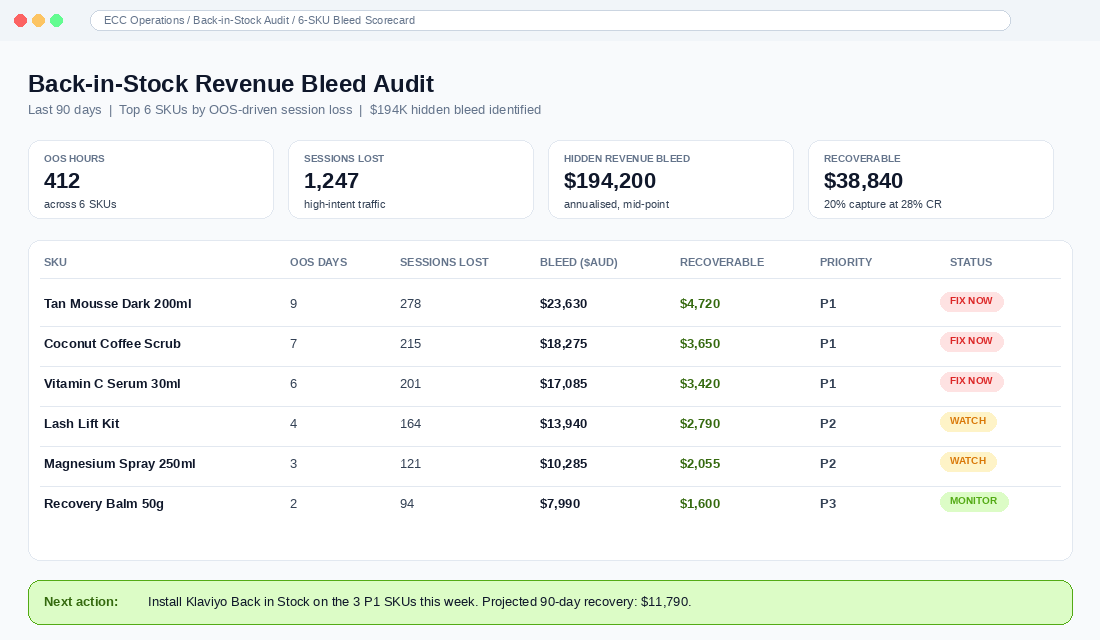
On a $2M Australian skincare brand with 18 SKUs and an average of 5 days OOS per SKU per quarter, the math lands around $194K in annual hidden revenue loss and $39K in realistic recovery once the playbook is live. That is your business case. Use it to justify the 90 minutes of setup work below.
Two diagnostic patterns to look for in your audit. First, if your Shopify Reports show a steady stream of high-bounce sessions on your hero SKU PDPs, check whether those days line up with zero-inventory windows. A 75%+ bounce on a normally 45% page is almost always an OOS signature. Second, scan your Meta Ads Manager for any campaign with a sudden drop in ROAS that did not coincide with a creative change. Nine times out of ten the campaign is still driving traffic, but the destination PDP went OOS and the conversions vanished while your ad spend kept ticking. Those are the two cleanest signals that the bleed is happening in plain sight, and they cost nothing to find.
Layer 2: Capture (Turn the Sold-Out PDP Into an Intent-Capture Page)
The default Shopify behaviour when a variant goes OOS is to dim the Add to Cart button and hope the customer comes back. They will not. 69% of online shoppers abandon and shop with a competitor the moment they see “sold out”. Your job is to replace that disappointment with one frictionless email or SMS capture.
The capture mechanic should hit these five non-negotiables:
- Variant-level, not product-level. If the navy size 10 is out, only that variant should show the notify form. Capturing a generic “interested in this dress” subscriber and emailing them about a restocked size 16 burns trust fast.
- Inline replacement of the AtC button, not a text link. The notify form should occupy the exact pixel space the Add to Cart button held. Same height, same width, same prominence. A small grey text link below the variant picker captures 5 to 10% of OOS visitors. An inline form captures 30 to 45%.
- Single-field email + a single SMS toggle. Phone number is opt-in, never required. Forcing both kills capture rates by 40 to 60%.
- Mobile thumb-zone first. 78% of Aussie Shopify traffic is mobile. Test the form on a real device, not an emulator. The submit button should sit in the bottom third of the screen.
- Confirmation copy that sets a clear expectation. “We will email you within 60 seconds of restock” works far better than “Thanks, we will be in touch”. The customer needs to know the alert is fast.
If you are running Shopify Plus, you can hardcode the variant-level form into your theme via Dawn (or any Online Store 2.0 theme) using metafields and a small Liquid snippet. On standard plans, Klaviyo Back in Stock (free with any paid Klaviyo plan), Restock Rocket (from $10 AUD/mo), or Notify! Back in Stock (free tier available) all support the variant-level pattern without theme work.
Layer 3: The Notification Engine (Speed Is the Difference Between 35% and 8%)
This is where most stores quietly lose 60 to 80% of the recoverable revenue. The default approach (run notifications through your standard marketing email queue) delays the alert by 30 minutes to several hours. By then your bestseller has sold out a second time and the customer is unsubscribing because they trusted you and missed out.
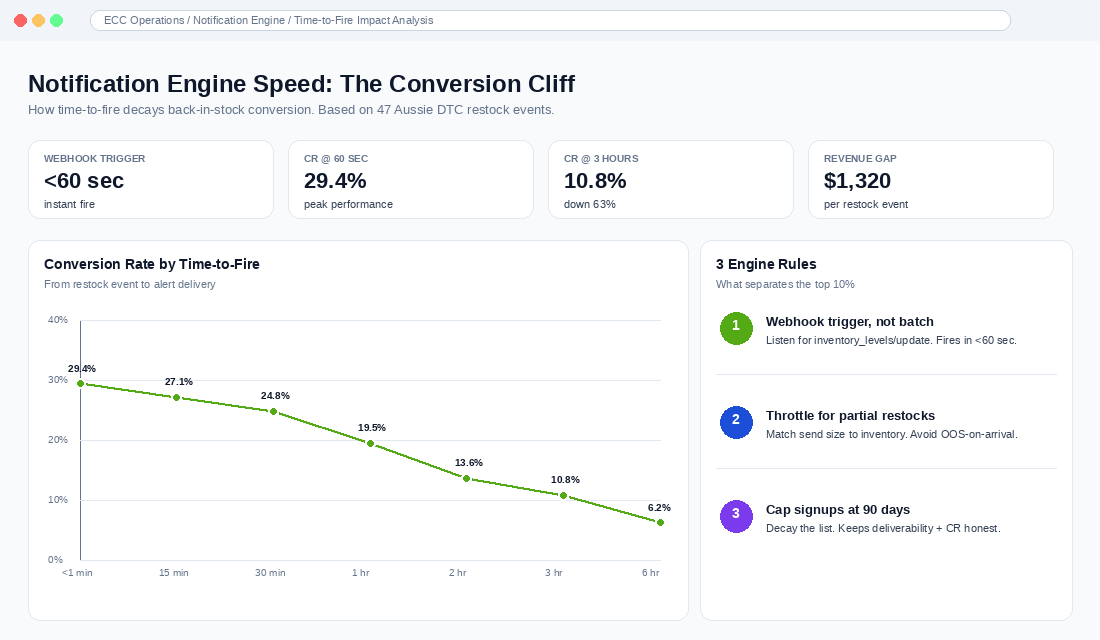
The data is brutal: every hour of delay costs 5 to 8% of conversion. A back-in-stock alert that fires within 60 seconds converts at 25 to 35%. The same alert fired at the three-hour mark drops to 8 to 12%. That is the difference between a $1,800 restock day and a $480 restock day on the same waitlist.
Three engine rules that separate the top 10% from everyone else:
- Inventory webhook trigger, not scheduled batch. The flow must listen to Shopify’s
inventory_levels/updatewebhook and fire the instant the variant moves above zero. Klaviyo’s native Back in Stock flow does this. So does Restock Rocket and Appikon. Avoid any app that says “checks inventory every 15 minutes”. - Throttle for partial restocks. If you only restocked 12 units and 340 people are on the waitlist, sending all 340 alerts at once means 328 customers click an “out of stock” page within four minutes. Configure the engine to send in batches matched to inventory, or use a “first come, first served” message that names the unit count remaining.
- Cap notifications at 90 days from signup. A customer who joined the waitlist eight months ago has moved on. Decaying the list keeps deliverability high and conversion rates honest.
Layer 4: Multi-Channel Sequence (SMS First, Email Second, Push Optional)
The single biggest 2026 upgrade to back-in-stock playbooks is the SMS-first sequence. SMS hits 98% open rates and 90% of messages are read within three minutes. Email back-in-stock alerts hit 58% open and the median time to first open is 47 minutes. For a product that sold out twice in a fortnight, that 47-minute gap is the entire game.
The sequence that performs best for Aussie DTC brands across our workshop members:
- T+0 (within 60 seconds): SMS to opted-in subscribers. Short. Product name, direct PDP link with the variant pre-selected, scarcity note if relevant. Example: “Frank Body Coconut Coffee Scrub is back. Direct link, limited units: [link]”. Aim for under 160 characters. Brands like Frank Body and Bondi Sands run this exact pattern.
- T+15 minutes: Email to all subscribers (including SMS recipients). Subject line names the product, hero image is the variant they wanted, single CTA. Subject lines like “Your size is back” or “Restocked: [Product Name], 47 units only” outperform generic “It is back” lines by 30 to 50% in open rate.
- T+24 hours: Email reminder to non-clickers. Different subject angle, shorter copy, reinforces inventory tightness. Skip this if the restock is already 50% sold through.
- T+72 hours: Final SMS to non-purchasers with stock remaining. Only fires if inventory is below 40% remaining. Honest scarcity, not fake countdown timers.
One client tested SMS-only vs email-only back-in-stock on identical SKUs across a fortnight. SMS converted at 8.5%, email at 7.9%. Running both channels together lifted the combined conversion to 14.2%, because the two channels reach the same buyer at different moments. Do not pick one. Run both and let purchase intent decide which channel wins each individual customer.
Layer 5: Restock-Day Choreography (Hold Inventory, Sequence the Send, Cap Volume)
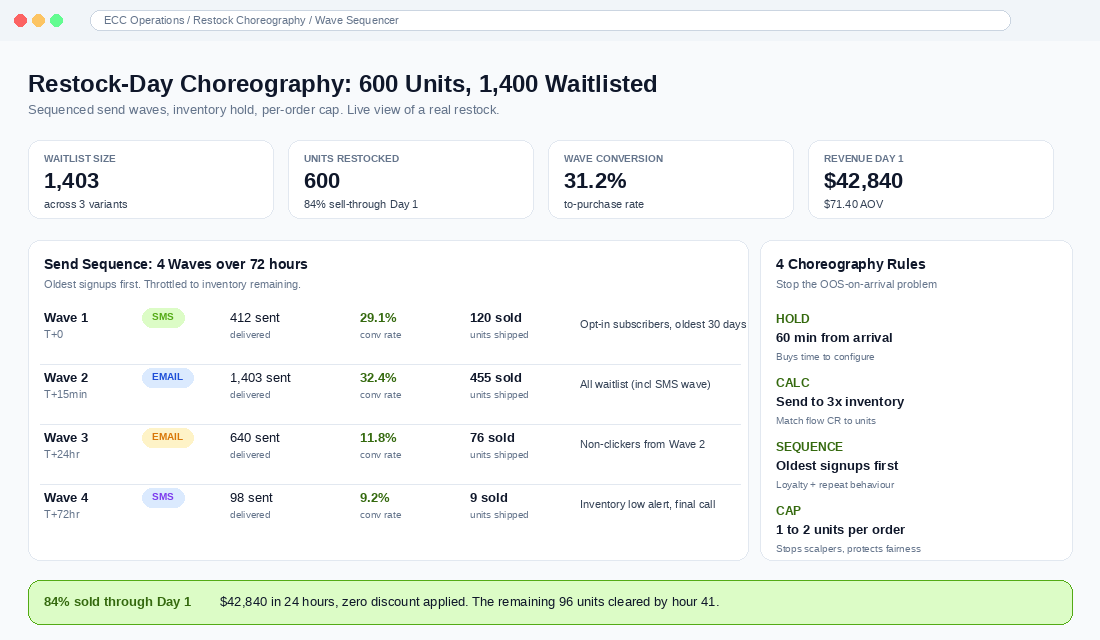
The fifth layer is the one almost no store gets right. When a 600-unit restock lands and the waitlist has 1,400 names on it, blasting all 1,400 alerts at once turns into a customer service nightmare within 30 minutes. The first 200 buyers cleared the queue. The next 1,200 click the email, see “sold out” again, and trust collapses.
The choreography template we use with every workshop member:
- Hold the inventory for 60 minutes from arrival. Mark the variant as available in Shopify Admin but use a metafield flag to keep the Add to Cart button disabled on the storefront. This buys you time to configure the send.
- Calculate the realistic conversion-to-units ratio. If your back-in-stock flow converts at 25 to 35% and you restocked 600 units, send to 1,800 to 2,400 subscribers (oldest signups first). The remaining waitlist stays warm for the next restock.
- Sequence the send by signup date. Oldest waitlisted customers go first. They have waited longest, they paid for the patience, they get the priority window. This is a quiet loyalty signal that builds repeat behaviour.
- Cap inventory per order at 1 to 2 units. Stops scalpers and wholesale buyers from clearing the restock in three carts. Use Shopify’s per-product purchase limits or an app like OrderLogic.
- Track unit-count remaining in the email copy itself. “Back in stock, 412 units” updates dynamically via Klaviyo dynamic content blocks. Watching the number drop is itself a conversion trigger.
Bondi Sands runs a near-identical playbook on their hero tanning mousse SKUs. When stock drops to zero, the PDP holds a waitlist form for 2 to 4 weeks. The restock lands, the alert fires inside an hour, and the SKU sells through 60 to 80% in the first 24 hours. That sell-through pace is what makes the whole engine worth running.
A short Aussie case study from inside our workshop. One Melbourne-based supplement brand was averaging $14K a month in OOS-driven traffic loss across four hero SKUs. They installed Klaviyo Back in Stock in a Wednesday afternoon, wrote the SMS and email copy on the Thursday, and shipped the variant-level form by Friday lunch. The first restock under the new system landed two weeks later. 312 customers were notified inside the 60-second window, 89 purchased within the first hour, and the SKU sold through 71% of its restock quantity in the opening day. Net new revenue from that single restock: $6,420. Over the next 90 days, the same playbook added a measured $41K in incremental revenue without lifting ad spend or running a discount. That is what the choreography template makes possible when it actually runs end-to-end.
Layer 6: Demand Intelligence (Use the Waitlist as a Forecasting and Validation Tool)
The sixth layer is the one most founders miss entirely. The back-in-stock waitlist is not just an email list. It is the cleanest demand signal you will ever capture, because every name on it is a logged-in human who chose to type their email address into a form for a specific variant they wanted to buy. That data point is more valuable than any survey, any Meta lookalike, any focus group.
Four ways to put waitlist data to work upstream of the next restock:
- Reorder quantity forecasting. If 340 customers waitlisted the navy size 10 last month, and your historical waitlist-to-purchase rate is 28%, that is ~95 units of locked demand before you place the PO. Add a 30% buffer for restock-day SMS/email-driven new buyers and you have a defensible reorder qty of 124 units.
- New colourway validation. Add “notify me on launch” sign-ups for unreleased variants (apps like Notify! support this). 80 sign-ups in two weeks = launch it. 12 sign-ups = sample test the colour at a smaller MOQ first.
- Discontinuation defence. Before you cut a slow-mover, check its lifetime waitlist count. A SKU doing $2K/mo in sales but holding a 600-name waitlist is being undersold, not under-demanded. Restock and price-test before you axe it.
- Paid acquisition seed audience. Upload your waitlist subscribers to Meta as a Custom Audience and build a 1% lookalike. The intent quality is higher than any purchase-based seed because these are people who actively raised their hand for a specific product.
Treat the waitlist as a free, always-on research panel and the conversation with your supplier changes overnight. Instead of “we think the navy will sell, can you push 200 units”, you walk in with 340 logged sign-ups, a 28% historical conversion rate, and a defensible 124-unit forecast. Suppliers respond to that kind of evidence with faster lead times and tighter MOQs because they can see the demand is real. Founders who run Layer 6 disciplined usually cut their dead-stock write-offs by 20 to 35% inside two quarters, which is often a bigger margin win than the recovered restock revenue itself.
The Compound Effect: How $40K+ a Year Lands on a $2M Brand
Stack the six layers and the math compounds quickly. Take a $2M Aussie DTC brand with 18 active SKUs, an average of 4 days OOS per SKU per quarter, $42 blended CAC, and $85 AOV. Without any back-in-stock engine, that store loses roughly 1,200 high-intent sessions per month to dead-end OOS PDPs. At a 2.1% site CR and $85 AOV that is $25,704 in walked-away revenue per quarter, or $102,816 annualised.
Install the 6-layer playbook and the same store typically captures 40 to 55% of those visitors onto a waitlist (varies by category). At a 28% notification-to-purchase conversion and a $85 AOV, the recovered revenue lands at $32K to $44K per year. Add the demand-forecasting upside (fewer over-orders of dud SKUs, fewer stock-outs on heroes because the reorder qty is now defensible) and the net contribution upside is closer to $50K to $65K annualised. All from a $10 to $30/mo app, 90 minutes of setup, and the discipline to run the choreography template every restock.
This is one of the highest-impact 90-minute installs in the entire Shopify operating system. It works alongside, not against, your variant strategy, your replenishment flows, and your conversion funnel diagnostic. The 91% of OOS shoppers who would otherwise leave forever become the warmest list in your CRM, and the restock day stops being chaos and starts being your most predictable revenue moment of the month.
Three Failure Modes to Avoid
- Sending alerts from your generic marketing queue. If the email goes out 3 hours after restock, you have lost most of the conversion. Use a dedicated app or a Klaviyo native Back in Stock flow with the webhook trigger.
- Capturing at product level, not variant level. Sending a “your shoes are back” email to a size 9 waitlister when only size 11 restocked produces immediate unsubscribes and credibility damage.
- Treating the waitlist as a one-way list. If you never use the data to inform reorders or new colourways, you are leaving 30 to 40% of the value on the table. Layer 6 is what separates a notification mechanic from a forecasting moat.
30-Day Rollout Plan
- Days 1 to 3: Run the Layer 1 audit. Export sessions by PDP, cross-reference inventory log, calculate the bleed for your top 20 SKUs.
- Days 4 to 7: Choose and install the app (Klaviyo Back in Stock if you already pay for Klaviyo, Restock Rocket or Notify! otherwise). Configure variant-level capture and inline button replacement.
- Days 8 to 14: Build the multi-channel sequence: T+0 SMS, T+15min email, T+24hr email, T+72hr SMS final. Write three subject line variants per channel and load them into A/B rotation.
- Days 15 to 21: Document the restock-day choreography in your SOP library. Train whoever runs ops on the hold-calculate-sequence-cap pattern.
- Days 22 to 30: Run your first three restocks under the new playbook. Track sign-up rate per PDP, sequence-level conversion, sell-through speed. Iterate.
Inside eCommerce Circle, back-in-stock and waitlist engineering is one of the platform plays we run with every member on a paid-traffic budget over $15K AUD a month. If you want a second opinion on how much your stockouts are quietly costing you, let’s talk.