Most Aussie founders plan next year by opening last year’s Shopify reports. You export twelve months of revenue, look at the shape, add a growth percentage, and call it a forecast. It feels rigorous because it is built on real numbers from your own business.
What’s in This Article
The problem is that your sales history only shows you demand you managed to capture. It does not show you the demand that walked past because you were out of stock in the second week of November, or the demand that never existed in the months you spent money as if it did.
Aussie shoppers spent a record 82.6 billion dollars online in 2025, up 14 per cent year on year, according to the Australia Post eCommerce Report 2026. That money does not arrive evenly. It arrives in waves, and the waves have moved. Black Friday and Cyber Monday have dragged the annual peak out of December and into November, and research from Prological’s Supply Chain Pulse Check Survey 2026 found spending stayed relatively flat until the third week of November before spiking sharply in the final week. If your plan is built on a 2019-shaped curve, you are staffing, buying and spending against a peak that no longer sits where you think it does.
Search demand is the cheapest leading indicator you have. It is free, it updates weekly, and it tells you what Australians are looking for before they buy. This is how to read it properly and turn it into a twelve month plan.
Why last year’s revenue is a lagging indicator
Your revenue curve is the product of two things multiplied together: how much demand existed, and how well you converted it. When you forecast off revenue alone, you bake last year’s mistakes into next year’s plan.
Say you sold out of your hero SKU on 20 November. Your revenue chart shows a flat line for the last ten days of the month. Forecast off that and you will under-buy again. Say you dumped 40 per cent of your ad budget into February because “February was big last year”, when February was only big because you ran a clearance that torched your margin. Forecast off that and you repeat it.
Search interest has neither of those distortions. Nobody’s stock position affects whether an Australian types “zinc sunscreen” into Google in October. It is a clean read on intent.
Three things you can only see in demand data, never in your own P and L:
- The true start of the season. Demand usually turns up four to eight weeks before your first order lands. That gap is where the cheap traffic sits.
- Demand you never served. Rising search terms in your category that you have no product, collection or landing page for.
- Demand that is leaving. A term that has fallen 30 per cent over three years is a range decision, not a marketing problem.
Step 1: Pull the five year curve in Google Trends
Google Trends is the fastest way to see the shape of your category. It is free, it goes back to 2004, and it can be filtered to Australia, which matters more than most operators realise.
Set it up like this:
- Go to trends.google.com and enter your primary category term. Use the term a customer would type, not your internal product name.
- Set Country to Australia. This is the step people skip. The global default is dominated by the United States, and the US summer is your winter.
- Set Time range to Past 5 years. One year of data cannot separate a seasonal pattern from a one-off spike.
- Leave Category as All categories on your first pass. Narrow it only if your term is ambiguous.
- Add a second term in the Compare box, same keyword, geography set to United States. You will see how far out of phase the two markets are.
- Scroll to Related queries, switch the toggle from Top to Rising, and copy anything showing a jump. These are the terms you have no page for yet.
- Export the CSV. Repeat for your top three to five category terms and put them in one sheet.
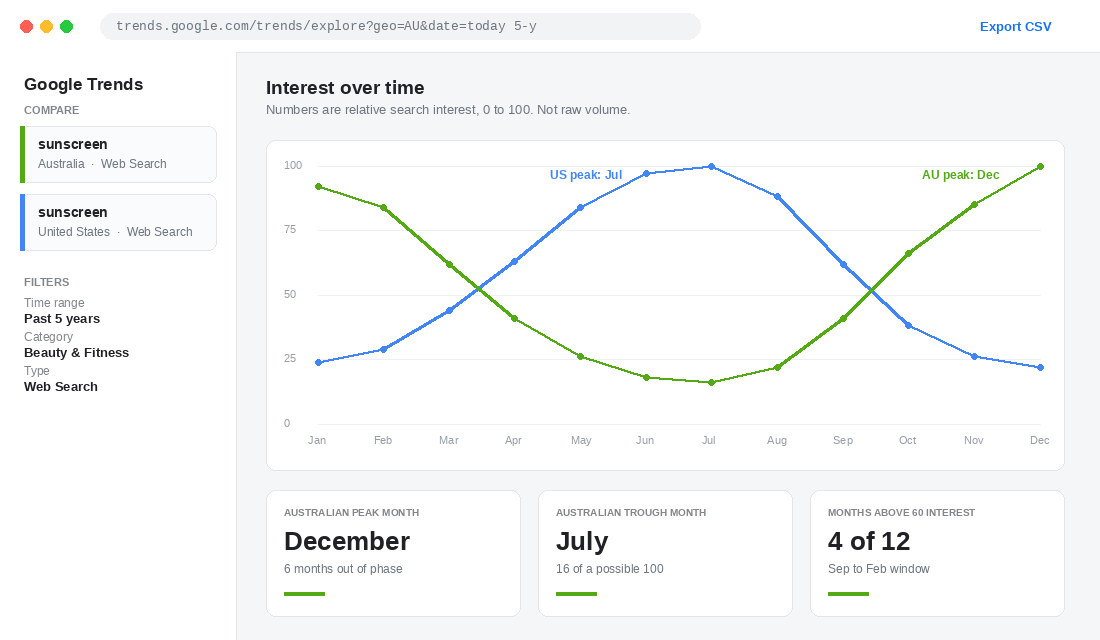
One warning that trips up a lot of operators. The 0 to 100 number on the Trends chart is relative search interest, not search volume. A score of 100 means “the busiest point in this particular chart”, nothing more. Change the date range, the country or the comparison terms and the whole scale re-baselines. Never merge two CSV exports that were pulled with different settings and never quote a Trends number as if it were a count of searches.
Trends gives you direction and timing. For size, you need a second tool.
Step 2: Turn relative interest into real volume
Google Keyword Planner is inside every Google Ads account, including one that is not currently spending. It gives you actual monthly search counts, and critically, it gives you the last twelve months month by month rather than an annual average.
- In Google Ads, open Tools, then Planning, then Keyword Planner.
- Choose Discover new keywords and paste in your category terms plus the rising queries you copied from Trends.
- Set the location to Australia and the language to English. Remove the default “All locations” or your numbers will be meaningless.
- Click into Historical metrics and set the date range to the last 12 months.
- Add the Avg. monthly searches column and expand the monthly breakdown. Download the CSV.
- In your sheet, calculate each keyword’s peak-to-trough ratio: peak month volume divided by trough month volume. This single number tells you how seasonal you really are.
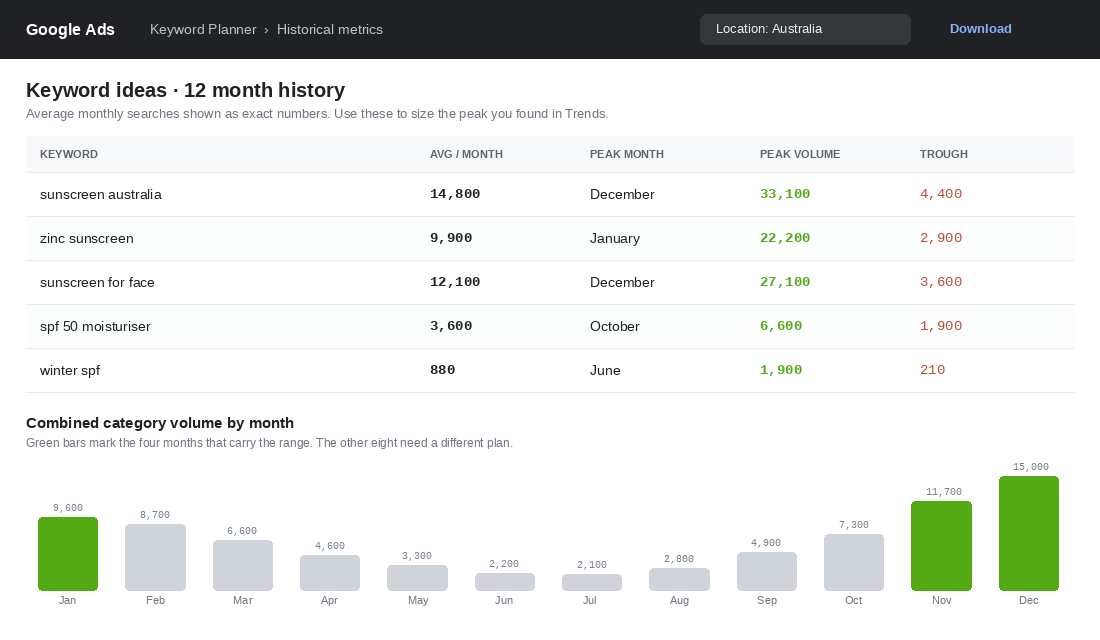
Read the ratio like this. Under 2 and you are effectively an all-year category, so smooth your buying and your spend. Between 2 and 4 and you have a real season worth planning around but a base worth protecting. Above 4 and you are a genuinely seasonal business, which means your cash cycle, not your marketing, is the constraint. Pair this with your inventory forecasting model before you place a single purchase order.
A free sanity check on both tools: open Shopify Analytics, go to Sessions over time, set the range to two years and switch the grouping to monthly. If your session curve and your search curve disagree badly, the gap is usually paid spend phasing rather than real demand.
Step 3: Overlay the Australian trading calendar
Natural category demand is only half the curve. The other half is manufactured by the retail calendar, and Australia’s calendar is not America’s. Australia Post found 73 per cent of shoppers now wait for sales events, and 40 per cent of Gen Z specifically hold out for Black Friday or Click Frenzy. That is a large chunk of your addressable demand deliberately parking itself in a handful of weeks.
The dates that bend an Australian curve in 2026:
- Afterpay Day, mid August. Fashion, beauty and homewares. A useful dress rehearsal for November.
- Click Frenzy Main, 10 to 12 November. The event that starts the Australian peak, roughly a fortnight before Black Friday.
- Black Friday, 27 November and Cyber Monday, 30 November. Promotional pressure now runs across the whole month, not the weekend.
- Boxing Day, 26 December. Still the deepest discounting of the year across most categories.
- End of financial year, June. EOFY drove a 14 per cent lift in online spend in the most recent June quarter, with 21.9 billion dollars transacted online.
Two implications most operators miss. First, EOFY is a genuine second peak for a lot of Australian brands and it sits in the calendar month that Northern Hemisphere playbooks treat as dead. Second, because promotional activity now stretches across all of November, your November average revenue per day is a misleading planning input. Plan the last week of November separately from the first three.
Step 4: Read the three curve shapes
Once you have five years of Australian data with the calendar overlaid, your category will look like one of three shapes. Each one demands a different decision.
The spike. One tall peak, a long flat trough, peak-to-trough above 4. Think sunscreen, swimwear, gifting, anything Christmas-adjacent. Your risk is cash, not conversion. You buy in your worst cash month and sell in your best, so working capital is the binding constraint. The correct move is to shorten the buy cycle, split purchase orders, and keep a top-up order sitting with the supplier that you can trigger the moment week one of the peak reads above plan.
The plateau. A broad lift across four to six months with soft edges. Think winter apparel, homewares, pet, supplements. Your risk is fading too early. Most brands pull creative and budget the moment the peak week passes, and give away the back half of a season that still has 60 to 70 per cent of its demand left. The correct move is a defined taper, not a stop.
The drift. No meaningful season, but a clear multi-year slope up or down. Think most consumable and B2B-leaning categories. Seasonality is a distraction here. Your whole job is reading the three year trend line and deciding whether to double down or start ranging the replacement. This is a range planning conversation, not a promotional one.
Write down which of the three you are before you argue about ad budget. Roughly half the disagreements I see between founders and their media buyers are two people planning against different curve shapes without saying so.
Step 5: Work backwards from the peak
Knowing your peak month is useless on its own. The value is in counting backwards from it, because almost every lever you have needs a run-up longer than most founders allow.
Working lead times for an Australian Shopify brand, counted back from week zero of the peak:
- Minus 16 to 14 weeks. Purchase orders placed for imported stock. Sea freight from Asia plus port and 3PL handling rarely comes in under ten weeks door to door, and November is the worst possible month to discover otherwise.
- Minus 10 weeks. Photography and creative brief locked. You cannot shoot a summer campaign in the week you need to run it.
- Minus 8 weeks. Landing pages, collection pages and structured data live so Google has time to index and rank them.
- Minus 6 weeks. Paid creative in market at low budget purely to find winners. Testing during the peak is the most expensive learning you will ever buy.
- Minus 4 weeks. List warming begins. Email and SMS to existing customers, not offers yet, just relevance.
- Minus 2 weeks. Code freeze on the theme. Peak week is not the time to ship a new cart drawer.
- Minus 1 week. Support scripts, stock buffers and shipping cut-off dates published on site.
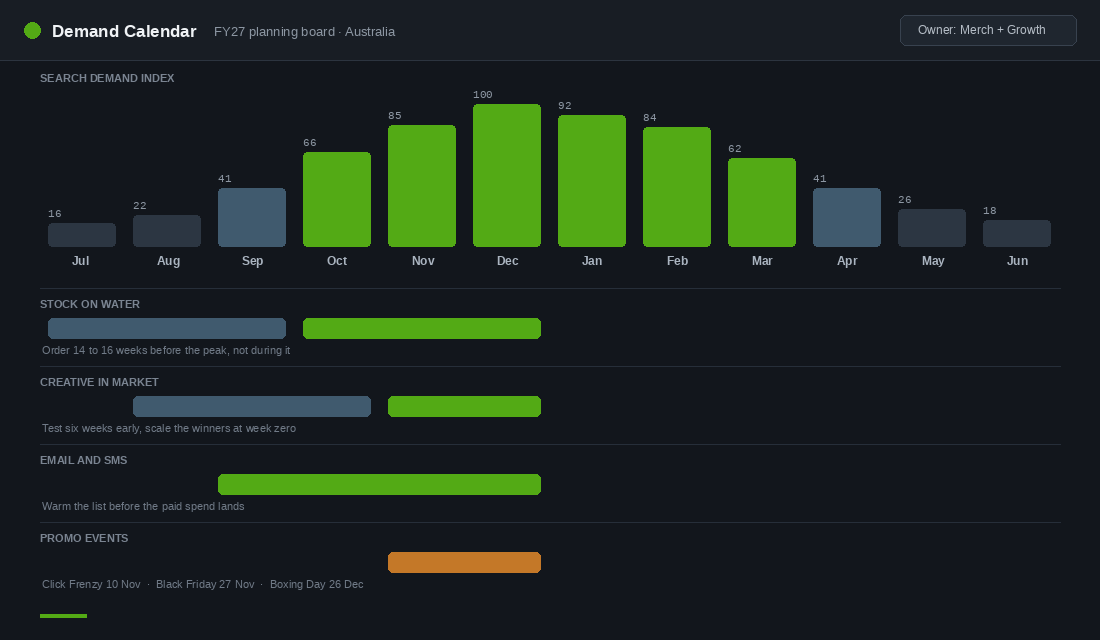
The reason to draw this as lanes rather than a list is accountability. When stock, creative, lifecycle and events all sit under the same demand curve, it becomes obvious who is late and what it will cost. Run a full dress rehearsal at minus 6 weeks so the gaps surface while they are still cheap to fix.
Step 6: Build a plan for the trough
Here is the part almost nobody plans. Agency benchmarks routinely put seasonal direct-to-consumer brands at genuinely profitable for only about four months of the year, with the other eight quietly consuming the cash the peak generated. Your fixed costs do not take winter off.
There are three honest options in the trough, and picking one deliberately beats drifting through all three badly.
- Reframe the category. Bondi Sands has spent 2026 pushing its “Summer Never Ends” positioning, deliberately treating summer as a mindset rather than a three month window. When you hold roughly 60 per cent of the Australian self-tan market, growth has to come from stretching the season, not taking more share of it.
- Sell into the opposite hemisphere. Rip Curl has been making swimwear since 1969 and Seafolly since 1975, and both built export businesses where the Australian off-season is somebody else’s peak. Shopify Markets makes a version of this available to brands far smaller than those two. Your July is Europe’s July too.
- Change what you sell in the gap. Use the rising queries you pulled in step one. If your customers are searching for something adjacent in your trough months, that is a range extension with demand evidence attached rather than a hunch.
Retention work also pays disproportionately in the trough. Australia Post found households now shop across an average of 16 brands a year with an average basket of 96 dollars. Being one of those 16 is a year-round job, and the quiet months are when your email and SMS programme earns its keep without competing against a wall of promotional noise.
The twelve month demand calendar
Put it together as one sheet. Twelve rows, one per month, and these columns:
- Search index. The 0 to 100 figure from your Australian Trends pull, averaged across your top category terms.
- Category volume. Total monthly searches from Keyword Planner, so you can size the month in real numbers.
- Events. Any calendar dates landing that month, with the exact date not just the month.
- Stock action. Order, receive, top up, or clear. Driven by the minus 16 week rule.
- Creative action. Shoot, test, scale, or taper.
- Lifecycle action. The one email or SMS play that month owns.
- Cash position. Expected in or out. This column is what turns a marketing plan into a business plan.
- Owner. One name per row. Not a team.
Review it monthly against actuals and re-pull the Trends data quarterly. The curve moves. The November shift proves that.
Why this compounds
Each of these steps is worth something on its own. Together they change the kind of decisions you are able to make.
Knowing the peak month stops you buying late. Knowing the peak-to-trough ratio tells you how much working capital the year actually requires. Knowing the curve shape stops you switching off a plateau season six weeks early. Knowing the rising queries gives you a ranging decision backed by evidence. Knowing your lead times means creative gets tested cheaply instead of expensively.
None of it is a growth hack. It is the difference between running a year and reacting to one. The brands that pull away in Australia are rarely the ones with the cleverest ads. They are the ones who had the right stock, on the right pages, with the right creative already tested, in the fortnight the whole country decided to spend.
Open Google Trends, set the country to Australia, set the range to five years, and look at your own category. If the shape surprises you, that surprise has been costing you money for years.
Inside eCommerce Circle, demand planning is one of the core pillars we work on with every member, because it sits underneath ranging, cash and spend all at once. If you want a second opinion on your curve before you commit to next year’s buy, let’s talk.