Open your Shopify admin and count your active variants. Then ask yourself a harder question: how many of them did you consciously decide to keep this year?
What’s in This Article
For most Aussie stores doing between $40k and $500k a month, the honest answer is almost none. The range grew by accident. A colourway here, a bundle there, a limited edition that never got retired, a supplier minimum that forced a size you never wanted. Nobody sat down and killed anything, because killing a product feels like admitting a mistake.
Here is the number that should change how you think about it. In a typical Shopify catalogue, roughly 20% of your products generate about 80% of your revenue, while the bottom C-grade tier contributes around 5%. That bottom tier is not free. Low-demand stock adds an extra 15% to 40% of the product cost every year just to sit there, and across ecommerce as a whole, carrying costs run at 20% to 30% of inventory value annually. Stores under $1m in revenue sit at the ugly end of that range, 25% to 30%.
So the long tail of your range is not a harmless bit of choice for customers. It is a standing order against your cash, your warehouse, your photography budget and your attention. This article gives you the range plan we run with members: five roles, one ceiling, one gate, one quarterly review.
Why Range Creep Is the Quietest Profit Leak in Your Store
Range creep is quiet because it never shows up as a line item. There is no row in your P&L called “cost of products we should have killed”. The damage is spread across a dozen places where it looks like something else.
It shows up as cash. Every dollar sitting in a slow variant is a dollar not sitting in the hero product you keep going out of stock on. It shows up as freight, because you are paying to airfreight your best seller while a pallet of the wrong colourway takes up floor space at the 3PL.
It shows up as attention, which is the one you feel most. Every extra SKU needs photography, copy, a size chart, reviews, a place in the navigation, an answer when support gets asked about it, and a decision at every reorder cycle. Multiply that by 60 variants and your merch calendar becomes maintenance work instead of growth work.
And it shows up in conversion. Shoppers who cannot tell the difference between your four moisturisers do not buy the best one. They buy nothing and come back later, or never. Choice paralysis is real, and a bloated collection page is the most common cause of it on Shopify stores we audit.
The big brands already know this. Unilever discontinued 17% of its SKUs in 2023, not because those products were embarrassing, but because the complexity cost more than the revenue was worth. If a business with that much scale advantage is cutting, a founder-led Aussie brand with one warehouse and one merch person has no excuse for a range that has never been pruned.
Step 1: Grade the Range You Already Have
You cannot plan a range until you can see it. Before you argue about what to launch next quarter, you need a single sheet that grades every active variant on two axes: revenue share and contribution per unit.
Shopify gives you half of this for free. The ABC analysis by product report sorts every variant into three grades based on revenue share over your chosen window. A-grade variants are the top 80% of revenue, B-grade the next 15%, and C-grade the final 5%. In most stores, the A tier is a shockingly small number of products.
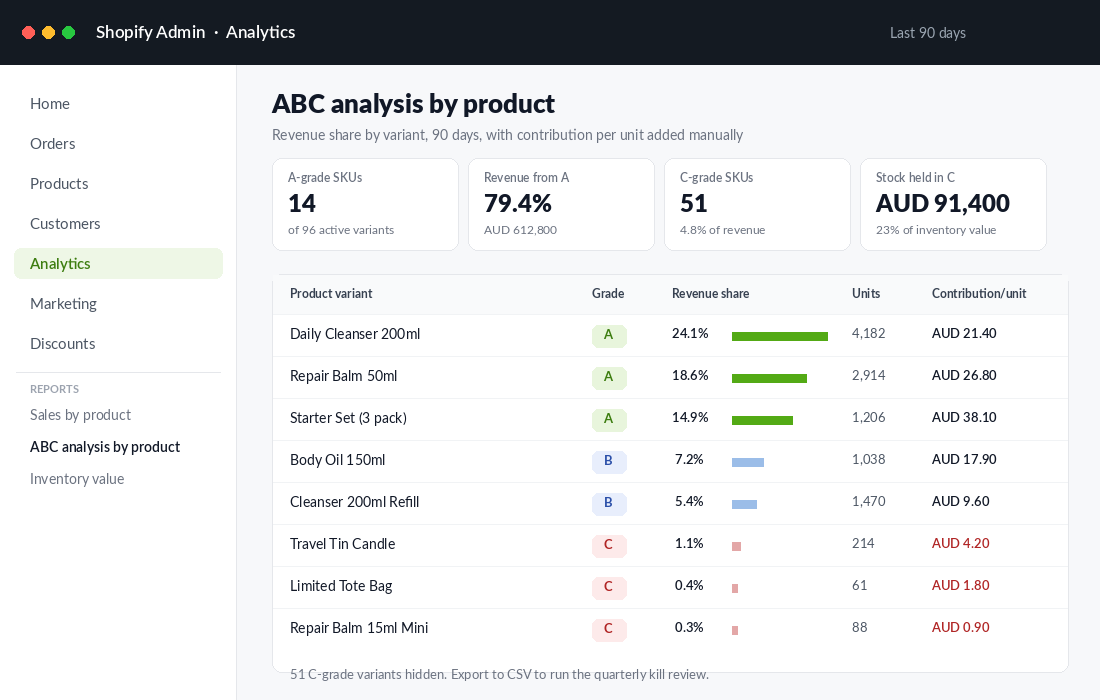
Here is the trap. Shopify’s ABC grade is calculated on retail revenue only. It excludes discounts and ignores cost of goods entirely. That means a heavily discounted, low-margin bundle can grade as an A while a quiet, fat-margin refill grades as a B. Revenue rank is not profit rank.
So export the report to CSV and add three columns yourself:
- Landed cost per unit. Product cost plus freight, duty and inbound handling. Not the supplier invoice figure.
- Contribution per unit. Net selling price after average discount, minus landed cost, minus pick, pack and outbound freight, minus payment fees.
- Stock value on hand. Units multiplied by landed cost, so you can see the cash each variant is holding hostage.
Now sort by contribution per unit and look at your C tier again. If you find variants sitting on five figures of stock and returning less than ten dollars a unit in contribution, you have found the first thing to fix. If you have never built this view before, our contribution margin playbook walks through the calculation line by line.
Step 2: Give Every SKU One Job (The 5 Roles)
Most founders judge products on one metric, usually revenue or margin, and then get confused when a low-margin product turns out to be strategically important. The fix is to stop asking “is this product good” and start asking “what job does this product do”.
Every variant in your range gets exactly one role. Not two. If you cannot assign a role in one sentence, that is your answer.
- Hero. This acquires new customers. It carries your paid traffic, your best creative and your strongest reviews. It does not need the highest margin in the range, but it must have the clearest promise. Most stores can support one hero, two at most.
- Profit. This funds the business. High contribution per unit, usually sold to people who already trust you, rarely the thing you advertise cold. Refills, concentrates, larger formats and premium tiers live here.
- Frequency. This brings people back on a predictable clock. Consumables, replenishables and anything with a natural reorder window. Frequency products are worth keeping at thinner margins because they buy you repeat purchase rate.
- Basket. This lifts average order value but almost never sells on its own. Add-ons, applicators, travel sizes, sleeves, spare parts. Judge these on attachment rate, not on standalone revenue.
- Halo. This earns attention and credibility. The limited run, the collaboration, the flagship piece that gets photographed. Halo products are allowed to be commercially marginal, but you are only allowed a small number of them and they must be time-boxed from day one.
Run this over your export and two things happen fast. First, you find products doing a job you already have covered three times over. Second, you find gaps. Plenty of Aussie brands have three heroes fighting each other for the same ad budget and not a single frequency product, which is exactly why their repeat rate is stuck.
The role also tells you which metric to judge the product on. Heroes are judged on new customer acquisition and cost per acquisition. Profit products on contribution dollars. Frequency products on reorder rate at 60 and 120 days. Basket products on attachment rate to the hero. Halo products on earned coverage and branded search lift. Judging a basket product on standalone revenue is how good products get killed for the wrong reason.
Step 3: Set a Range Ceiling Before You Set a Launch Calendar
A launch calendar without a ceiling is just a plan to get fatter. The ceiling is the number that forces trade-offs, and it should be set by your cash, not your ambition.
Work it out like this. Decide the maximum amount of cash you are willing to have sitting in stock at any point in the year. Divide that by the average landed value of one variant at your target weeks of cover. That gives you a hard number of variants your balance sheet can actually carry.
A worked example. Say you are comfortable with 300,000 dollars in stock, your average variant needs 10 weeks of cover, and 10 weeks of cover on an average variant is about 5,000 dollars of landed value. Your ceiling is 60 active variants. Not 61. If you want to launch three new variants next quarter, three existing variants have to go.
Then layer two secondary limits on top:
- No more than 25% of active variants may be C-grade. Some tail is healthy. A tail that is half your catalogue is not a tail, it is the dog.
- No more than 10% of active variants may be halo. Halo products are the easiest to justify emotionally and the easiest to over-index on.
The ceiling does something a spreadsheet cannot: it changes the conversation in your merch meeting. Instead of “should we launch this”, the question becomes “is this better than the weakest thing we currently stock”. That is a much sharper question, and it is one your team can actually answer with data.
Step 4: Put Every New Product Through a Launch Gate
New products fail more often than founders expect. A study published in Marketing Letters that tracked 83,719 SKUs across 31 consumer packaged goods categories found roughly 25% were discontinued within the first year and 40% by the end of year two. Nielsen’s numbers are harsher again, with 85% of new consumer packaged goods products not surviving twelve months.
You are not going to beat those odds with enthusiasm. You beat them by refusing to write the first purchase order until the product clears a written gate. Six questions, and the product needs all six.
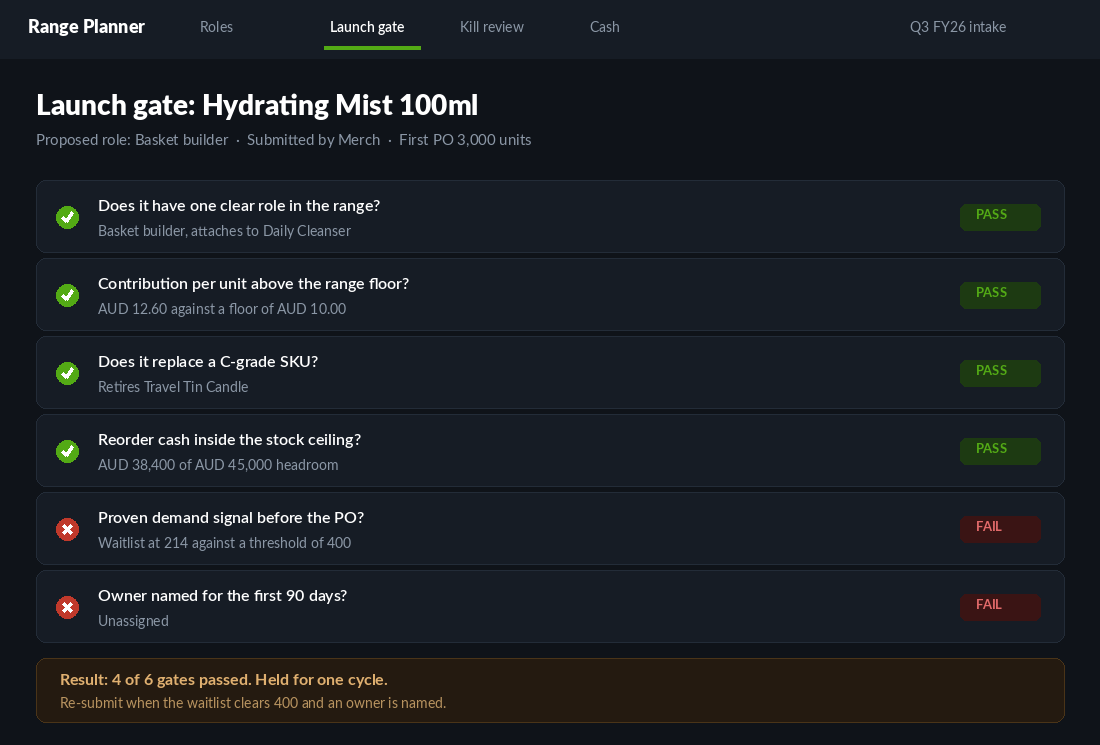
- Does it have one clear role? Hero, profit, frequency, basket or halo. If two people give two different answers, it fails.
- Is contribution per unit above your range floor? Set a floor in dollars, not percentages, and hold the line. Percentage margin hides small absolute numbers.
- What does it replace? Name the variant it retires. This is how the ceiling gets enforced rather than admired.
- Does the reorder cash fit inside the stock ceiling? Including the second purchase order, not just the first.
- Is there a demand signal before the purchase order? A waitlist, a pre-order, a sold-out sample run, a survey with real intent. Set a numeric threshold and do not move it after the fact.
- Who owns it for the first 90 days? One name. Unowned launches are the ones that never get a second campaign and quietly become C-grade.
The gate is not there to stop you launching. It is there to stop you launching from a supplier’s sample kit at a trade show. Products that clear all six get a proper launch with budget behind them. Products that clear four get held for a cycle, which is almost always the right call and almost never the popular one.
If the product in question is a whole new category rather than a variant, the stakes are higher and the filters are different. We covered that decision separately in the second product line playbook.
Step 5: Run a Kill Review Every Quarter
The gate controls what comes in. The kill review controls what goes out, and it is the step almost nobody runs. Put it in the calendar as a recurring 90 minute meeting, the week after quarter end, with the graded export open on screen.
Any variant that meets two or more of these conditions goes on the kill list automatically:
- C-grade for two consecutive quarters
- Contribution per unit below your range floor
- More than 26 weeks of cover on hand at current sell-through
- Attachment rate below 5% for a basket product, or reorder rate below 15% at 120 days for a frequency product
- Past its time box, in the case of a halo product
Being on the kill list is not a death sentence. It triggers a decision with three options: retire it, fold it into something else, or fix it with a named intervention and one quarter to prove itself. What you are not allowed to do is nothing.
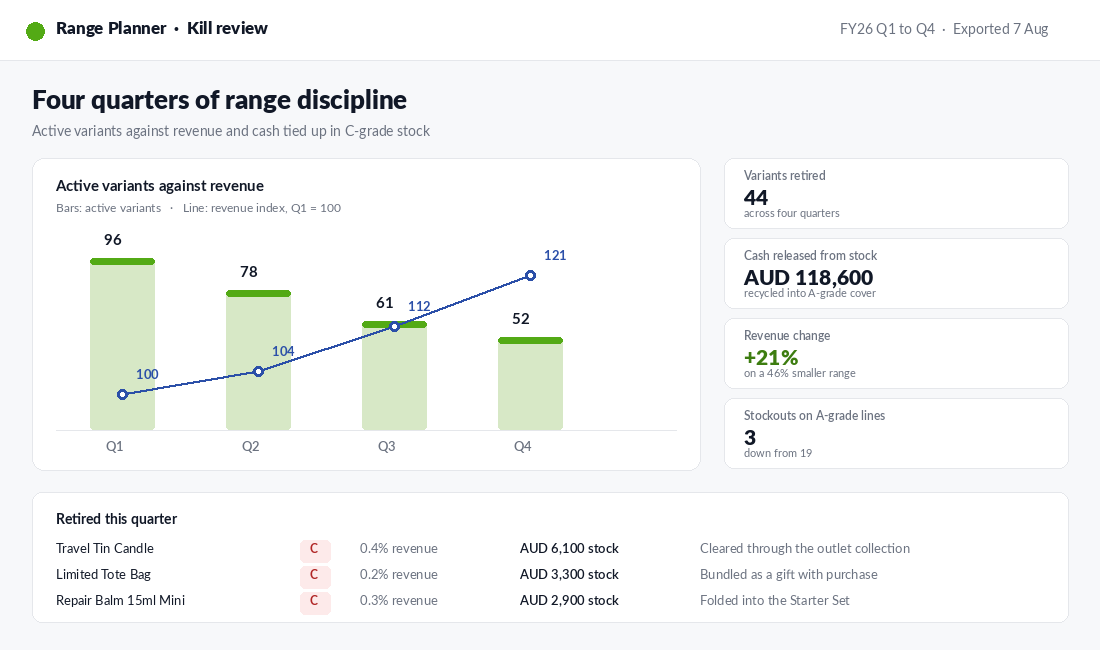
Retiring a product properly matters as much as deciding to. Sell the remaining units through an outlet collection, bundle them as a gift with purchase, or fold them into a starter set rather than discounting them on the main collection page and training your list to wait for sales. Redirect the product URL to the closest live product so you keep the link equity. Then archive rather than delete, so your historical reporting stays intact.
If your kill list is long the first time you run this, do not try to clear it in one quarter. Our dead stock playbook covers how to turn that pile back into cash without wrecking your brand positioning.
Setting Up the ABC Report Properly (10 Minutes)
You do not need a new app to start. Shopify’s built-in report gets you most of the way, and it is available on every plan above Basic. Here is the exact setup.
- In Shopify admin, go to Analytics, then Reports, then search for ABC analysis by product.
- Set the date range to the last 90 days. Shorter windows over-punish seasonal lines, longer windows hide a product that has already died.
- Add the columns for units sold and ending inventory quantity so you can calculate weeks of cover in the same sheet.
- Export to CSV. Add your landed cost, contribution per unit and stock value columns as described in step one.
- Add a role column and fill it in for every variant. Do this once properly and it takes about an hour for a 100 variant catalogue.
- Save the file as your range master and re-export the Shopify data into it each quarter rather than starting fresh.
When the manual export starts to hurt, usually somewhere past 150 variants or once you are running multiple warehouses, graduate to a purpose-built forecasting tool such as Inventory Planner or Prediko. Both pull Shopify sales history and give you cover, reorder points and sell-through by variant without the spreadsheet work. Do not buy either of them until you have run the manual version at least twice. The discipline is the product, not the software.
What Two Australian Brands Get Right About Range
Go-To Skincare launched in 2014 with five products: a lip balm, a cleanser, a moisturiser, an exfoliant and a multipurpose body oil. Five. In a category where the default move is to launch a twelve-step routine and hope something sticks, Zoë Foster Blake’s team built the brand on a range small enough that every product had an obvious job and a clear reason to exist next to the others. The brand went on to sell to BWX and was bought back by its founder for 21.8 million dollars. Range discipline was not the only reason, but it is what made the early marketing so easy to write.
Who Gives A Crap, out of Melbourne, has built a business turning over the equivalent of tens of millions of pounds a year on essentially three product lines: toilet paper, tissues and paper towels, with a small number of formats within each. Revenue grew 18% to nearly 39 million pounds in the year to June 2023. There is no version of that business where the answer to slowing growth is a fourth and fifth category. The growth comes from frequency and subscription depth inside a narrow range.
Both brands make the same trade. They accept a smaller addressable basket in exchange for operational simplicity, a clearer story and cash concentrated behind the things that work. That is the trade most stores get backwards.
The Compound Effect of a Disciplined Range
Each of these five steps is useful on its own. Together they change the physics of the business, and the effect compounds in a specific order.
Grading frees cash first. Cutting the C tier releases stock capital in the first quarter, and at 20% to 30% annual carrying cost, that cash was actively costing you money to hold. Roles then direct where the freed cash goes, which is almost always deeper cover on the A-grade lines you keep selling out of. Fewer stockouts on the hero lifts revenue without a single extra dollar of ad spend.
The ceiling stops the cash leaking back out, because now every launch has to displace something. The gate raises the quality of what does get through, so your hit rate on new products climbs above that grim 25% first year failure baseline. The kill review keeps the whole thing honest quarter after quarter, and by the fourth cycle it stops feeling like surgery and starts feeling like housekeeping.
The end state is a store with fewer products, more cash, better in-stock rates on the lines that matter, faster photography and copy cycles, cleaner collection pages and a merch meeting that takes 30 minutes instead of two hours. Smaller range, bigger business. That is the whole trade.
Your One-Page Range Plan
Copy this into a doc and fill it in this week. It should fit on one page. If it does not, your range is telling you something.
- Range ceiling: ____ active variants, derived from ____ dollars of stock at ____ weeks of cover.
- Range floor: minimum ____ dollars contribution per unit for any new variant.
- Role mix target: ____ hero, ____ profit, ____ frequency, ____ basket, ____ halo.
- Tail limit: C-grade variants may not exceed 25% of the active range.
- Launch gate: six questions, all six required, purchase order blocked until signed off.
- Demand threshold: ____ waitlist signups or pre-orders before any first purchase order.
- Kill review: quarterly, week one after quarter end, owner ____.
- Kill triggers: two or more of C-grade twice, below floor, over 26 weeks cover, role metric missed, time box expired.
- Retirement method: outlet collection first, gift with purchase second, discount on main collection never.
- This quarter: ____ variants in, ____ variants out. Net change must be zero or negative until the tail limit is met.
Fill in the ceiling and the floor first. Those two numbers do more work than the other eight combined, because they turn every future range decision from an opinion into an arithmetic problem.
Inside eCommerce Circle, range planning is one of the core pillars we work on with every member, because it is the fastest way most stores free up cash without touching their ad spend. If you want a second opinion on yours, let’s talk.