Most Aussie Shopify founders set up Google Shopping the same way. They install the Google app during launch week, connect the feed, spin up one Performance Max campaign across the whole catalogue, and let it run. Google reports a 4x return, so it stays untouched for months.
What’s in This Article
Then they look at the bank account. Revenue is flat, ad spend keeps creeping up, and nobody can explain why the “profitable” channel is not producing profit. The problem is not Google Shopping. The problem is running it on defaults.
The numbers say this channel deserves real attention. Australians spent a record $69 billion online in 2025, up 12% year on year, with 9.8 million households now buying online. And Shopping ads consistently post the highest return of any Google campaign type, averaging around 5.4x across ecommerce categories. The founders capturing that upside are not smarter. They just treat Shopping as a system with five moving parts instead of a set-and-forget app.
Why Google Shopping Punches Above Its Weight
Meta ads create demand. Google Shopping captures it. When someone types “mens trail runners size 11” into Google, they see your product photo, your price and your brand before they ever click. That single difference changes the economics of the click.
Because the shopper has already seen the product and the price, the click arrives pre-qualified. Australian agency data shows Shopping campaigns generating roughly twice the revenue of Search campaigns on the same budget, with Shopping traffic converting at up to three times the rate of standard Search clicks.
It also matters that Aussie shoppers are deal hunters. Australia Post found 8 in 10 online shoppers actively hunt for the best price. Shopping ads put your price next to your competitors before the click, which means the visitors you pay for have already accepted your number. That is a filter most channels cannot offer.
So why do so many stores lose money on it? Because the channel has three failure points that defaults never fix: a weak product feed, a lazy campaign structure, and measurement that flatters itself. The five parts below fix each one in order.
Know the Benchmarks Before You Judge Your Own Numbers
Before you touch the five parts, anchor yourself to what normal looks like. Founders quit this channel too early because they compare their week-three numbers to a fantasy, and stay too long on bad setups because they have no reference point at all.
Across ecommerce categories in the latest benchmark rounds, Shopping ads average a click-through rate of about 1.4%, a cost per click of roughly $1.60 in Australian terms, and a conversion rate close to 2%. Cost per conversion lands near $75 AUD on average, with competitive categories like electronics running higher. Your numbers will move around those marks depending on niche, price point and season.
Run the maths on your own store before you set a single bid. Say your average order value is $110 and your gross margin after COGS and shipping is 55%, giving you about $60 of contribution per order. At a 2% conversion rate you need 50 clicks per sale. At $1.60 a click, that sale costs $80 to buy. You are underwater by $20 on first order, which means this channel only works for you if repeat purchase is real, or if you lift AOV or conversion rate first.
That single calculation explains why two stores can run identical campaigns and get opposite outcomes. The store with a $110 AOV and no repeat purchase engine loses money at benchmark performance. The store with a $180 AOV wins at the exact same click cost. Know which store you are before Google spends your money finding out.
- If your AOV is under about $100: fix economics first. Bundles, gift-with-purchase thresholds and stronger product pages move the breakeven line before you scale spend.
- If your conversion rate is under 1.5%: the site is the bottleneck. Shopping traffic is high intent, so a weak conversion rate on it points at your product page, price competitiveness or shipping surprise at checkout.
- If both are healthy: you have permission to scale, and the five parts below decide whether that scale is profitable.
Do not ignore the free listings
One more baseline worth claiming: once your feed is live in Merchant Centre, your products become eligible for free listings across Google surfaces at no cost per click. Free listings will not build a business on their own, but they are incremental sales for zero media spend, and they reward exactly the same feed quality work you are about to do in Part 1. Clean titles and complete attributes get paid twice.
Part 1: Fix Your Feed Before You Touch a Campaign
In Shopping, you do not write ads. Google assembles them from your product feed: the title, image, price and attributes you sync from Shopify. Which means feed quality is not admin work. It is your ad copy, your keyword targeting and your Quality Score rolled into one.
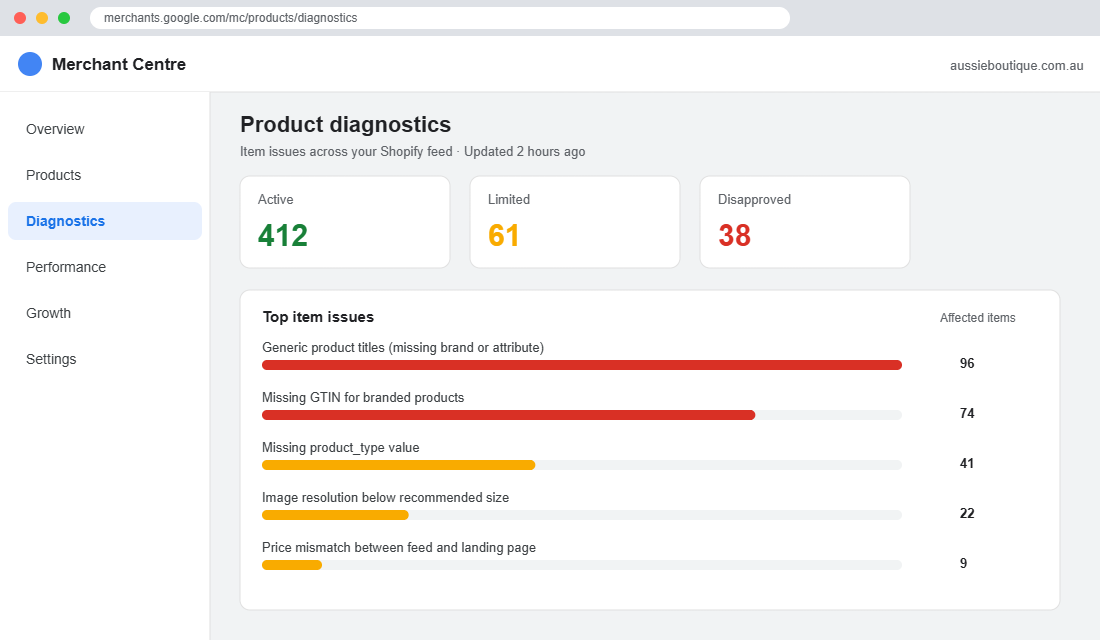
When an Australian homewares retailer on Shopify was audited recently, the feed had 218 data quality issues, including missing GTINs and generic product titles. The store had spent eight months paying for traffic while telling Google almost nothing about what it was selling.
Three fixes move the needle fastest:
- Rewrite titles like search queries. Google matches Shopping ads on your product title, and shoppers scan the first 70 characters. Use the pattern Brand + Product Type + Key Attribute + Size or Colour. “Everyday Linen Sheet Set King Sage” beats “The Dreamer Set” in every auction that matters.
- Add GTINs to every branded product. The barcode number (UPC or EAN) matches your product to Google’s product graph, unlocks comparison placements, and increasingly feeds eligibility for Google’s AI-driven shopping surfaces. In Shopify, it lives in the Barcode field on each variant.
- Fill product_type and google_product_category. These tell the algorithm what the product actually is, which sharpens matching and cuts wasted clicks from irrelevant searches.
The tool: the Google & YouTube app for Shopify
The free Google & YouTube app in the Shopify App Store is the right starting point for almost every store. Setup takes about 20 minutes:
- Step 1. Install the Google & YouTube app from the Shopify App Store and open it from your admin.
- Step 2. Connect your Google account, then select or create a Merchant Centre account when prompted.
- Step 3. Confirm your store requirements: a live refund policy, contact page and checkout that Merchant Centre can verify.
- Step 4. Authorise the product sync. Your catalogue flows to Merchant Centre automatically, and changes sync within 24 to 48 hours.
- Step 5. Open Merchant Centre and check the Diagnostics tab weekly. Disapprovals and limited items here are invisible revenue leaks.
The app passes validation on its own. It does not optimise titles or add missing attributes for you. That part stays your job, and it is the highest-leverage hour you will spend on this channel.
Part 2: Pick the Campaign Type That Matches Your Stage
Google will push you toward Performance Max. It now soaks up 62% of all Shopping spend, and for good reason: it is genuinely powerful once it has data. The catch is in that last clause. PMax is a machine learning system, and machine learning is only as good as the volume feeding it.
The working rule: PMax needs around 50 conversions a month to learn properly, plus a clean feed and decent creative assets. Below that, the algorithm guesses. And recent benchmark data shows old-fashioned Standard Shopping still delivering a cost per acquisition about 5 dollars cheaper than PMax on average, with some datasets showing Standard Shopping returning 5.2x against 4.1x for PMax.
Here is how that translates for an Aussie store:
- Under 50 paid orders a month: run Standard Shopping. You keep control of bids, you see every search term, and you build the conversion history PMax will need later.
- 50 to 150 paid orders a month: run both. Keep Standard Shopping on your proven sellers and let a PMax campaign hunt incremental volume across YouTube, Display and Gmail placements.
- 150+ paid orders a month: PMax can lead, but split it into multiple campaigns by category or margin band so budgets do not pool in whatever converts cheapest.
One campaign across the whole catalogue is the single most common structure mistake. In the homewares audit mentioned earlier, the top 15 SKUs drove 61% of revenue yet had no bid differentiation from the other 400 products. The bestsellers subsidised the dead stock for eight months straight.
Part 3: Stop Letting Brand Searches Flatter Your Numbers
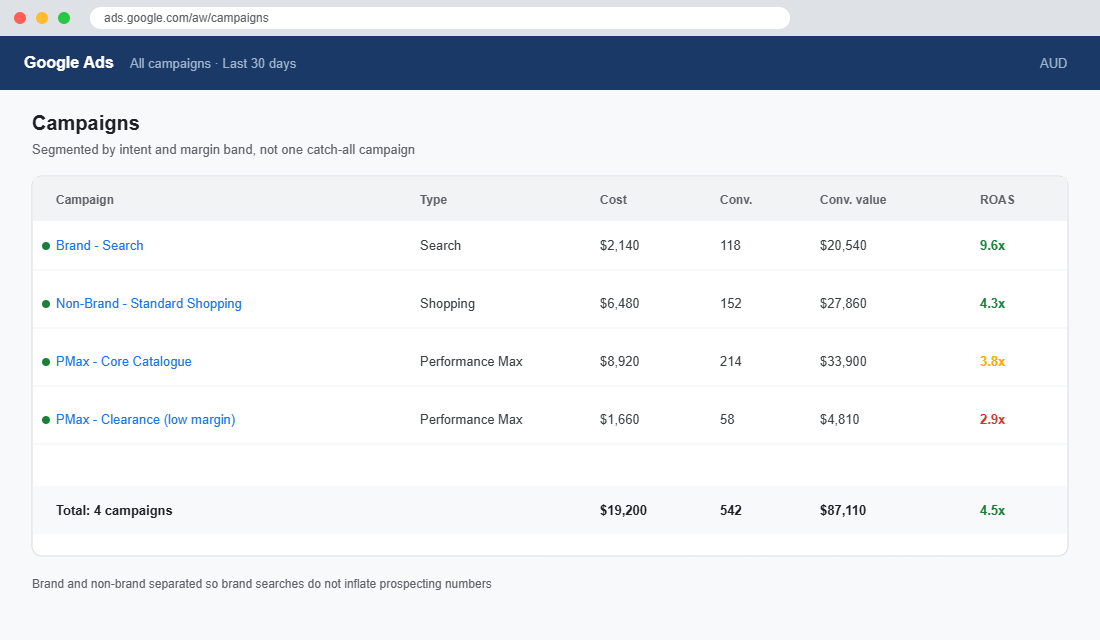
This is the sneakiest leak in the whole channel. By default, PMax happily serves ads on searches for your own brand name. Those clicks convert brilliantly, because the shopper was already coming to you. The campaign then wears those conversions like a medal.
In the audited Australian account, 34% of PMax conversions were brand-term driven. A third of the reported performance was revenue the store would have collected anyway. That is not marketing. That is paying Google a toll on your own front door.
The fix takes one afternoon:
- Add brand exclusions to PMax. Google now lets you exclude brand lists at the campaign level. Use it, and let organic or a cheap dedicated brand Search campaign catch those searches instead.
- Add brand negatives to Standard Shopping. Negative keywords on your brand name and misspellings push those queries to the campaign built for them.
- Report brand and non-brand separately. Non-brand ROAS is the number that tells you whether Google is finding you new customers. Expect brand campaigns to post 8x to 10x while true prospecting sits at 2.5x to 4x. Both are fine. Blending them into one average is not.
Part 4: Bid on Margin, Not Revenue
Google optimises to whatever you ask for. Ask for revenue and it will buy you revenue, including revenue that loses money after COGS and shipping. A 4x ROAS on a 20% margin product is a slow bleed. The same 4x on a 65% margin product is a growth engine.
The mechanism for fixing this is custom labels. In your feed, tag each product with a margin band: custom_label_0 set to high, mid or low. Then build campaigns or asset groups per band and give each its own target:
- High margin (60%+): aggressive targets around 2.5x to 3x ROAS. You can afford to buy growth here, and this is where new customer acquisition should concentrate.
- Mid margin (40 to 60%): moderate targets around 4x. Steady volume, watched weekly.
- Low margin (under 40%): conservative targets of 6x or higher, or exclude these products entirely and let them sell through bundles that protect your blended margin.
This one change, bidding by contribution instead of by topline, is the difference between a channel that looks good in Google Ads and a channel that shows up in your bank account.
Part 5: Measure What Is Real, Not What the Platform Reports
Every ad platform marks its own homework. An analysis of 253 media mix models covering 383 million dollars in spend found platform-reported ROAS runs 2x to 5x higher than true incremental impact. Google Ads is not lying to you, exactly. It is claiming credit for conversions that overlap with email, organic, and shoppers who would have found you anyway.
You do not need a data science team to correct for this. You need two habits:
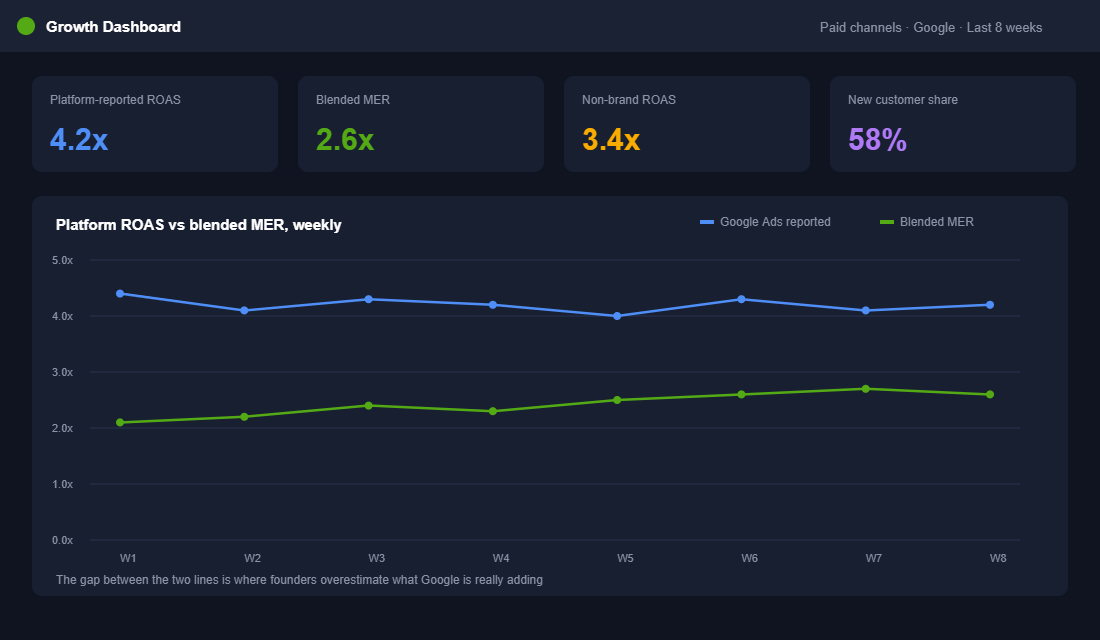
- Track blended MER weekly. Total revenue divided by total ad spend, across every channel. If Google Ads reports 4.2x but your blended MER sits at 2.6x and does not move when you scale Google spend, the platform number is flattering itself.
- Run crude holdout tests. Drop Shopping spend 30% for two weeks in one product category and watch what happens to total sales in that category. If revenue barely moves, that spend was buying credit, not customers.
While you are in the data, check your device split. Desktop Shopping traffic converts around 4.3% against 3.5% on mobile, a 24% gap, yet mobile takes roughly 60% of impressions. If your mobile conversion rate lags badly, the fix is usually on your site, not in your bidding. Start with the product page and the checkout, because every dollar of Shopping spend lands on one or the other.
The Compound Effect: Why the Five Parts Beat Any One of Them
None of these five parts is dramatic on its own. Together they compound, because each one feeds the next.
A clean feed earns better matching and cheaper clicks. Better structure routes those clicks to the products that deserve them. Brand separation stops the reporting from lying to you. Margin-based bidding turns accurate reporting into profitable decisions. And honest measurement tells you when to scale with confidence instead of hope.
This is how the strongest operators run the channel. Koala built its growth engine by pulling Google marketing in-house and treating testing and measurement as a weekly discipline rather than an agency report. Kogan has run performance marketing with the same ruthlessness for over a decade, and its entire model depends on knowing the real cost of every sale. Neither of them found a secret setting. They just refused to run on defaults.
A store spending $10,000 a month on a default single-campaign setup and a store spending the same $10,000 on the five-part system can post identical platform ROAS numbers. Twelve months later, one has a growing customer file and widening margins. The other has a Google Ads dashboard that looks great and a P&L that does not.
Your Google Shopping Weekly Scorecard
Here is the takeaway to keep. Twenty minutes, once a week, same order every time:
- Merchant Centre diagnostics: zero new disapprovals, limited items trending down.
- Feed coverage: your top 20 revenue SKUs all active, with keyword-rich titles and GTINs.
- Non-brand ROAS: tracked separately from brand, measured against your margin-based target.
- Search terms: scan Standard Shopping terms, add negatives for irrelevant queries, note new phrases worth targeting.
- Budget pooling: check spend by product group. If one low-margin category is eating budget, cap it.
- Device split: compare mobile and desktop conversion rates. A widening gap is a site problem wearing an ads costume.
- Blended MER: one number, tracked weekly, on the same dashboard as your platform ROAS so the gap stays visible.
Month one, run it as a rollout: week one on the feed, week two on structure, week three on brand separation, week four on margin bidding and measurement. After that, the scorecard keeps the system honest.
Inside eCommerce Circle, Promotion is one of the 10 P’s we work through with every member, and Google Shopping is usually where the fastest wins hide. If you want a second opinion on yours, let’s talk.
Related reading: setting up your Google Shopping product feed.