Your reorder point is the stock level that tells you to place a purchase order today, and the formula is: (average daily sales x lead time in days) + safety stock. Most Shopify stores skip it, reorder when the shelf looks bare, and spend the year swinging between stockouts that kill sales and overstock that kills cash.
Here is the part nobody tells you at the start. Inventory is the biggest cheque most product businesses write, and it is usually managed by feel. A founder looks at a number in Shopify admin, thinks “that seems low”, and places an order that lands six weeks later. By then the bestseller has been sold out for three weeks and the slow mover has another 200 units sitting next to it.
The brands that scale cleanly do something boring. They know each SKU’s reorder point, they check days of cover weekly, and they set the buying rhythm before the sale starts, not during it. This guide gives you the whole system in the order to build it: classify your stock, calculate reorder points, set safety stock, automate alerts with free Shopify tools, and plan for the two supply shocks that hit Australian stores every year.
If you only have ten minutes, jump to the one-page checklist near the end. If you want to stop guessing, read on.
Why Shopify inventory management is a profit problem, not an admin task
Stockouts and overstock look like opposite problems. They are the same problem: the quantity you bought did not match the quantity you sold, and nobody was watching the gap.
The scale is bigger than most founders assume. IHL Group research reported by Retail Dive put worldwide lost sales from out-of-stocks at about US$984 billion, and found shoppers hit an out-of-stock on as many as one in three trips in some categories. More recent IHL work, summarised by Retail Insight Network, estimates inventory distortion (overstocks plus out-of-stocks) at roughly US$1.7 trillion, about 6.2% of worldwide retail sales, with out-of-stocks making up 65.6% of it.
Australian shoppers behave the same way. A Power Retail report from the 2020 supply crunch found 28.3% of Australian online shoppers tried to buy an out-of-stock item in September 2020 and 34.5% the following month. Of those who hit a shortage, 52% went without the item entirely and only 17% planned to wait for a restock. That data is older, but the behaviour has not changed: when you are out of stock, most shoppers do not wait for you.
The other side of the ledger is cash. The commonly quoted rule of thumb is that holding stock costs 20% to 30% of its value every year once you add capital costs, storage, insurance, shrinkage and markdowns (ranges vary by source and category, see this roundup of carrying cost studies). On $60,000 of stock at cost, that is $12,000 to $18,000 a year you pay to keep it on the shelf. Overstock is not a safe place to hide. It is an expense.
So the goal is not “never run out” and it is not “hold as little as possible”. The goal is to hold the right amount of each SKU for the lead time you actually face. That is a calculation, and it is easier than it sounds.
Step 1: Split your range into A, B and C stock before you calculate anything
Not every SKU deserves the same attention. If you apply the same rigour to a $9 phone case and your hero product, you will burn your week on the wrong things.
Run a simple ABC analysis on the last 90 days of sales by SKU, ranked by revenue:
- A items: the top SKUs that make about 80% of revenue. Usually 10 to 20% of your range. These get weekly review, tight reorder points and a safety buffer.
- B items: the next 15% of revenue. Review fortnightly with standard reorder points.
- C items: the long tail making about 5% of revenue. Review monthly, order in bulk less often, and ask whether they earn their shelf space at all.
Shopify now includes an ABC analysis report in admin (stores on lower plans may need an app for it, per this comparison of Shopify’s native inventory tools). If you would rather do it yourself, export orders to a spreadsheet, sum revenue by SKU, sort high to low and mark where the running total crosses 80% and 95%.
This single step changes how you spend your attention. Most Aussie stores we coach find their A items are also their biggest stockout risk, because they sell the fastest and get reordered last. If you want to go deeper on which SKUs actually return cash, the GMROI stock audit ranks products by gross margin earned per dollar of stock, which is the next lens to apply.
Step 2: Calculate days of cover for every A and B SKU
Before you work out a reorder point, get one number on every SKU: days of cover. It tells you how many days you can keep selling at the current rate before you hit zero.
Days of cover formula
- Days of cover = units on hand ÷ average daily sales
- Average daily sales = units sold in the last 30 to 90 days ÷ number of days (exclude sale spikes, use a separate multiplier for those)
- Compare days of cover to your supplier lead time. If cover is lower than lead time, you are already late.
Take the Merino beanie in the example below. You have 126 units, you sell 6 a day, and your supplier takes 21 days. Your cover is 21 days, exactly your lead time, which means that if you place an order today and nothing goes wrong, you will land at zero stock the day the delivery arrives. That is not a plan. That is a coin flip.
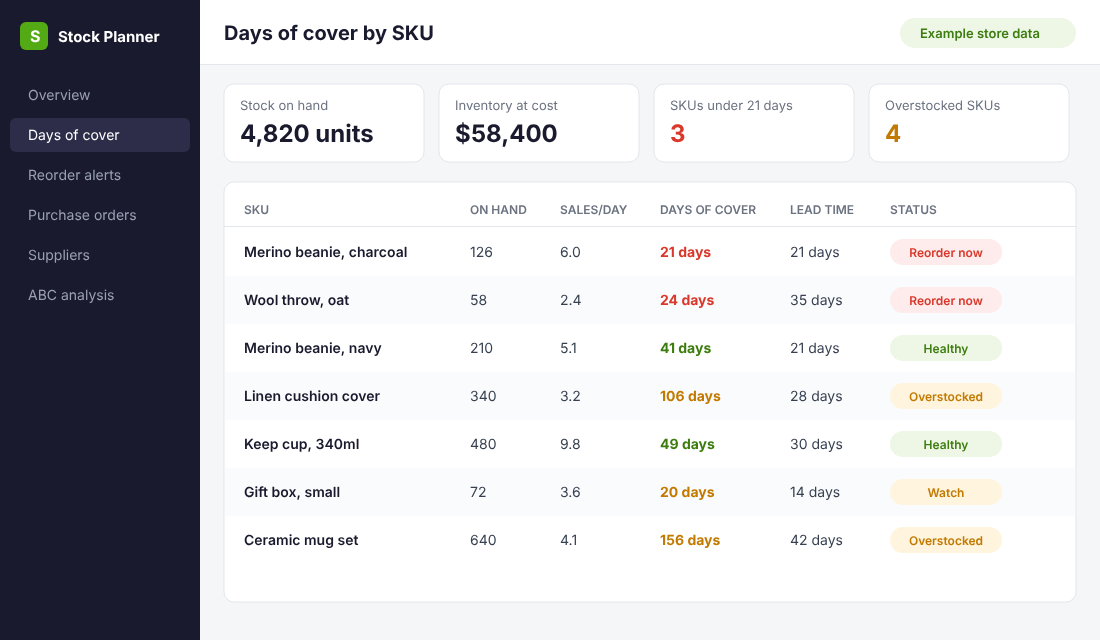
Look at the colour pattern in that table. Two SKUs are in the red because cover is at or below lead time. Two SKUs are overstocked at 106 and 156 days of cover, which is roughly three to five months of cash sitting on a shelf. A store without this view usually spots the red ones too late and never spots the overstocked ones at all.
Build this view in a Google Sheet or Excel to start. Pull on-hand quantity from Shopify’s inventory export, pull 60-day unit sales from an orders export, and add one formula column. Update it every Monday. It takes about 20 minutes and it is the highest-value 20 minutes in your week.
Step 3: Set a reorder point for each SKU (with a worked example)
A reorder point (ROP) is the on-hand quantity at which you place a new order. If your stock hits that number, you order. No debate, no gut feel.
The standard formula, which Shopify’s own retail guide also uses, is:
Reorder point formula
- Reorder point = (average daily sales x average lead time) + safety stock
- Safety stock = (highest daily sales x longest lead time) – (average daily sales x average lead time)
- Lead time = supplier production time + freight + time to receive and put away in your warehouse or 3PL
Here is the maths for our beanie, using real-looking inputs from a 90-day window.
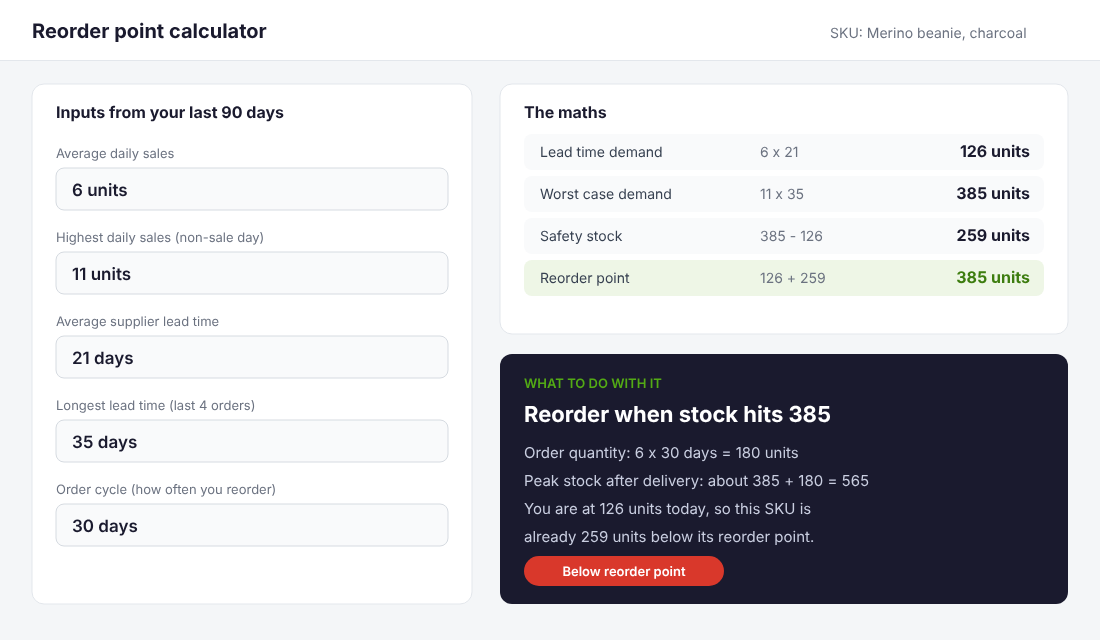
- Average daily sales: 6 units. Highest daily sales on a normal, non-sale day: 11 units.
- Average lead time: 21 days. Longest lead time across the last four orders: 35 days (a freight delay).
- Lead time demand: 6 x 21 = 126 units.
- Worst case demand: 11 x 35 = 385 units. Safety stock: 385 – 126 = 259 units.
- Reorder point: 126 + 259 = 385 units.
That is a big buffer, and it should be. This formula covers the worst sales day meeting the worst delivery delay, which is the combination that actually empties your warehouse. If 385 units feels like too much cash to tie up, you have two honest options: shorten the lead time (a faster supplier, air freight on the top-up order, a local 3PL) or accept a higher stockout risk on that SKU. What you should not do is ignore the number.
A simpler version if you hate spreadsheets
For B items and smaller stores, use a buffer-days shortcut. Set safety stock as a fixed number of days of average sales: 7 days for fast suppliers and stable demand, 14 days for most overseas suppliers, 21 or more for single-source or long-haul products. For the beanie, 14 days of buffer is 6 x 14 = 84 units, so the reorder point is 126 + 84 = 210 units. It is less precise and a lot easier to maintain, which means it actually gets done.
How much to order when you hit the reorder point
The reorder point tells you when. Order quantity tells you how much. A practical rule: order enough to cover your order cycle, which is how often you plan to buy. If you reorder every 30 days, order 30 days of sales (6 x 30 = 180 units), adjusted for supplier minimums and any known seasonal lift. Then check the result against your cash. If a single purchase order uses more than the cash you planned for that month, your open-to-buy budget is the missing piece. It caps how much stock you can buy per month before the maths breaks your cash flow.
Step 4: Adjust for seasonality before the season starts, not during it
Everything above uses average daily sales, which is fine in a flat month and wrong in November. A reorder point set on October’s sales rate will leave you short for Black Friday and Cyber Monday, because your rate of sale in that week might be two to four times normal.
Fix it with a seasonal multiplier. Take last year’s unit sales for the same SKU in the same week, divide by that SKU’s normal weekly sales, and you have your multiplier. If the beanie sold 6 a day normally and 18 a day in BFCM week, the multiplier is 3. For the sale window, use 18 as the average daily sales number, then recalculate. The reorder point jumps, which is the correct answer: you need more stock on hand to survive a week that sells three times as fast.
Black Friday 2026 lands on 27 November and Cyber Monday on 30 November. If your supplier lead time is 21 days, the last date you could have reordered for peak stock was around 6 November. If you are reading this after that, your move is not another overseas order. It is a plan for the stock you have: cap the discount on low-cover SKUs, lead your ads with the products you are well stocked on, and turn on back-in-stock notifications so you do not lose the shoppers who hit a sold-out page. Our guide to reading Australian search trends before you buy stock shows how to estimate that multiplier when you have no sales history.
The Australian calendar has a second trap. Christmas cut-offs hit while carriers are at capacity and you cannot rescue a stockout with a rush shipment. Plan peak stock around the inbound freight timeline, not around the date you wish it would arrive.
Step 5: Build in lead time risk, especially around Chinese New Year
Your formula is only as good as your lead time number, and lead times are not fixed. The one delay you can predict every year is Chinese New Year, and if you source from China or Southeast Asia, it should be a fixed date in your buying calendar.
Chinese New Year 2027 falls on Saturday 6 February 2027. According to this sourcing guide, the official holiday runs 5 to 12 February, but the practical shutdown lasts four to six weeks, with output often only 40 to 70% of normal in the first weeks after. The same guide suggests finishing production and shipping from the Chinese port by around 10 January 2027 for stock to land by the end of February.
What that means in practice for an Aussie store: any SKU you want on the shelf in March needs its purchase order placed before the end of November or early December, and your safety stock on those SKUs should go up for the quarter. Use the longest lead time you have seen, not the average, and add three weeks for the shutdown. That single change protects your best sellers through the exact window when most stores run dry.
Two other lead time risks to build into the formula: a supplier that has missed a date twice in the last year (treat their lead time as the longer figure), and single-source SKUs where there is no backup. For both, the answer is more safety stock until you have a second supplier or a local fallback.
Step 6: Automate alerts with free Shopify tools (no new app needed)
Here is the context that makes this step urgent. Shopify retired its Stocky inventory planning app after 31 August 2026, moving purchase orders, suppliers, receiving, transfers and inventory adjustments into Shopify admin instead. If you relied on Stocky for reorder suggestions, you now need to set your own. The native tools give you visibility and control, but as one independent comparison puts it, reorder points are “assemblable, not shipped”: there is no built-in reorder point field you set and forget.
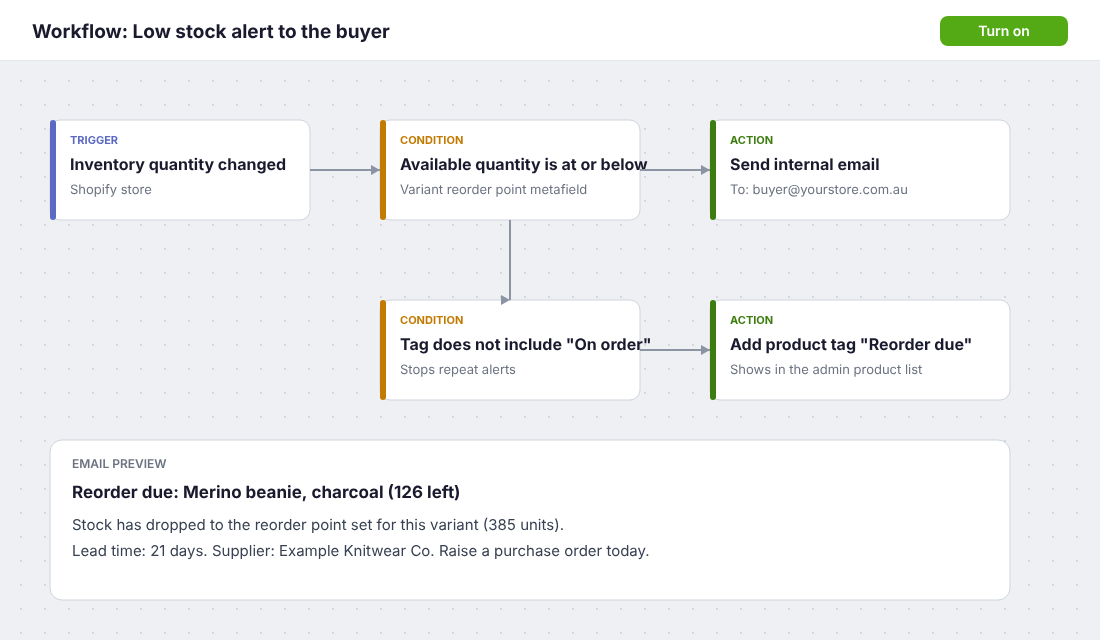
You can assemble it yourself in about 30 minutes using Shopify admin and Shopify Flow (the free automation app on most plans). Here is the setup:
- Create a metafield for reorder point. In Settings, then Custom data, then Variants, add a new integer metafield called “Reorder point”. This stores a number against each variant.
- Fill in the number for each A and B SKU using the formula in Step 3. Use the bulk editor to paste values from your spreadsheet.
- Open Shopify Flow and create a workflow with the trigger “Inventory quantity changed”.
- Add a condition: available quantity is less than or equal to the variant’s Reorder point metafield.
- Add an action: send an internal email to whoever buys stock, with the product name, quantity left and the lead time in the body. Add a second action to tag the product “Reorder due”.
- Add a stop condition: only run if the product is not already tagged “On order”. When you raise a purchase order, add that tag, so you do not get the same alert every time someone buys one more unit.
- Create purchase orders in Shopify admin (Products, then Purchase orders) and mark them received when stock lands so available quantity stays accurate.
A few limits to know. The Shopify purchase order feature has no email-to-supplier button, so you download the PDF and send it yourself, and supplier lead times can only be stored as metafields for reference. If you run more than a few hundred SKUs, multiple warehouses or need true demand forecasting, a dedicated inventory planning app will earn its fee. Price it against the carrying cost number from earlier: if an app saves you from even one $5,000 overstock, it has paid for the year.
Last thing on tooling: a reorder point is only as good as your on-hand count. Do a cycle count on your A items every month (count 10 to 20 SKUs a week rather than shutting down for a full stocktake) and fix variances in the admin straight away. If Shopify says 126 and the shelf says 98, every number in this guide is wrong.
What the brands that get this right actually do
Baby Bunting, the Australian baby goods retailer, is a useful reference even though it is far bigger than most Shopify stores. A case study published by its forecasting vendor, RELEX, reports that moving from manual store-level ordering to automated demand forecasting and replenishment lifted availability by 7%, to as high as 94%, while cutting inventory value by 8% in like-for-like stores. Read that again: better availability and less stock, at the same time. That is what happens when reorder decisions come from the data, not from whoever shouted loudest last week. (This is a vendor-reported result, and the case study does not state the timeframe, so treat it as direction rather than a promise.)
Amazon shows the cost of the other side. The same IHL study that Retail Dive reported found Amazon Prime members who hit an empty shelf were 52% more likely than other shoppers to buy online instead, and estimated up to 24% of Amazon’s retail revenue comes from customers who first tried to buy in-store. Your stockout does not just lose a sale. It sends the customer to a competitor who has the product, and some of them do not come back.
The lesson for a Shopify store is not to copy their technology. It is to copy the discipline: a number for every SKU, a rule for when to order, and someone who owns the review.
The compound effect: how the five pieces work as a system
Each step on its own helps a little. Together they change how the business runs.
- ABC classification tells you where to spend your attention, so the weekly review takes 20 minutes, not three hours.
- Days of cover shows you the problem SKUs early, in both directions: about to run out, and sitting on too much.
- Reorder points and safety stock turn “I think we need more” into a number you can defend to a supplier or a bank manager.
- Seasonal multipliers and the Chinese New Year calendar move your buying earlier, so peak stock lands before the peak.
- Flow alerts and purchase orders in admin make the rule run without relying on memory.
The cash effect is where it pays off. When overstock shrinks, cash comes back, which gives you room to buy deeper on the A items you keep running out of. Stockouts drop, so your ad spend stops sending traffic to sold-out pages, which lifts your blended return on ad spend without touching a single ad. Your supplier conversations get better, because you can say “I will order 180 units every 30 days” instead of “I will see how it goes”, and suppliers give better terms to buyers who are predictable.
That is the compound effect. Inventory discipline is not an operations chore. It is a margin and cash flow lever that sits underneath every marketing dollar you spend.
Your one-page Shopify inventory checklist
Copy this into your notes and run it this week.
Weekly inventory review (20 minutes, every Monday)
- Export on-hand quantity and the last 60 days of unit sales by SKU.
- Calculate days of cover for every A and B item.
- Flag any SKU where days of cover is at or below supplier lead time (order now).
- Flag any SKU above 90 days of cover (stop buying, plan a promotion or bundle).
- Check every open purchase order against its promised date. Chase anything late.
- Cycle count 10 to 20 A-item SKUs and correct any variances in admin.
Monthly setup (60 minutes, first week of the month)
- Refresh the ABC ranking from the last 90 days of revenue.
- Recalculate reorder points for A items using current average and longest lead times.
- Apply the seasonal multiplier for any sale or event in the next 8 weeks.
- Check the supply calendar: Chinese New Year, Christmas cut-offs, supplier shutdowns.
- Check open-to-buy: confirm this month’s purchase orders fit the cash you planned for stock.
One-time setup (about 30 minutes)
- Create the “Reorder point” variant metafield and fill it in for A and B items.
- Build the Shopify Flow alert with the “On order” stop tag.
- Turn on back-in-stock notifications for every A item.
- Set purchase order templates for each supplier, with lead time and minimum order quantity in your notes.
Where to start if you are overwhelmed
Pick your top five SKUs by revenue. Work out days of cover for each one today. If any are at or below supplier lead time, place the order first, then come back and build the system. Once the fires are out, set reorder points for those five, then expand to the next ten. You do not need to fix 500 SKUs. You need to stop your five biggest earners running out.
Inside eCommerce Circle, inventory planning sits inside the Practice pillar, the part of the More Orders Operating System that turns good intentions into a repeatable weekly rhythm. If you want to see exactly where your store is being capped, take the free More Orders Scorecard. It takes two minutes and shows you which of the 10 P’s to fix first.