It is the Tuesday morning ritual no founder forgets. You open the Shopify app with your coffee, glance at yesterday’s number, and your stomach drops. Revenue is down 30 per cent on last week. No warning, no obvious reason, just a smaller number staring back at you.
What’s in This Article
Here is what most founders do next: panic. They launch a flash discount, bump the ad budget, message their designer about a homepage refresh, and fire off a worried email to their agency. Five changes in 48 hours. When sales recover (and they usually do), nobody knows which change did it, or whether it would have recovered on its own. Nothing is learned. The next dip triggers the same panic.
Experienced operators do something different. They run a diagnostic, in a fixed order, before they change a single thing. A sales drop has a surprisingly short list of possible causes, and each one leaves fingerprints in your data. We have walked hundreds of Aussie Shopify founders through this exact sequence, and in most cases the real cause surfaces in under an hour. This is that sequence.
First, Make Sure the Drop Is Real
Before you diagnose anything, confirm you are comparing the right numbers. More than half the “sales drops” we get asked about are not drops at all. They are measurement artefacts, and they evaporate the moment you set up a fair comparison.
Three traps catch founders again and again:
- Mismatched days. Comparing a Monday to a Saturday, or a 4-day window to a 7-day window. Always compare like for like: this Tuesday against last Tuesday, this full week against last full week.
- Small-store noise. If you are doing fewer than about 30 orders a day, daily swings of 20 to 30 per cent are statistical noise, not a trend. One postcode having a bad day can move your whole number. Judge trends on 7-day rolling revenue, never single days.
- One-off distortions. A big wholesale order, an influencer spike, or a sale event in the comparison period makes the current period look sick when it is actually normal. Strip the outlier and compare again.
The rule: put 7-day rolling revenue against the prior 7 days, and against the same 7 days last year. If the drop survives both comparisons, it is real. Now you diagnose, and you do it in this order, because the checks are sequenced from most common cause to least.
Check 1: Rule Out Broken Tracking Before You Blame the Store
The first question is brutal but essential: did sales actually drop, or did your measurement break? Analytics tools undercount by design. Between ad blockers, iOS privacy prompts and consent banners, GA4 routinely misses around 1 in 5 Shopify orders. When a theme update wipes a pixel or a consent tool misfires, that undercount can double overnight, and your dashboard shows a “crash” while the bank account stays healthy.
The check takes five minutes. Open Shopify admin and count actual orders for the period (Shopify is the source of truth because it is tied to money, not scripts). Then compare against GA4 purchases and your Meta pixel events for the same window. If Shopify orders are steady but GA4 or Meta shows a cliff, you have a tracking problem, not a sales problem. Common culprits worth checking:
- A theme update or app install that removed or duplicated your pixel snippet.
- An expired Meta Conversions API token, which quietly stops server-side events and makes campaigns look dead.
- A consent banner change that started blocking analytics for a chunk of visitors.
Fixing tracking is its own project, and we have covered it step by step in our conversion tracking playbook. For today, you only need the answer to one question: do Shopify orders confirm the drop? If yes, keep going.
Check 2: Follow the Traffic and Find the Quiet Channel
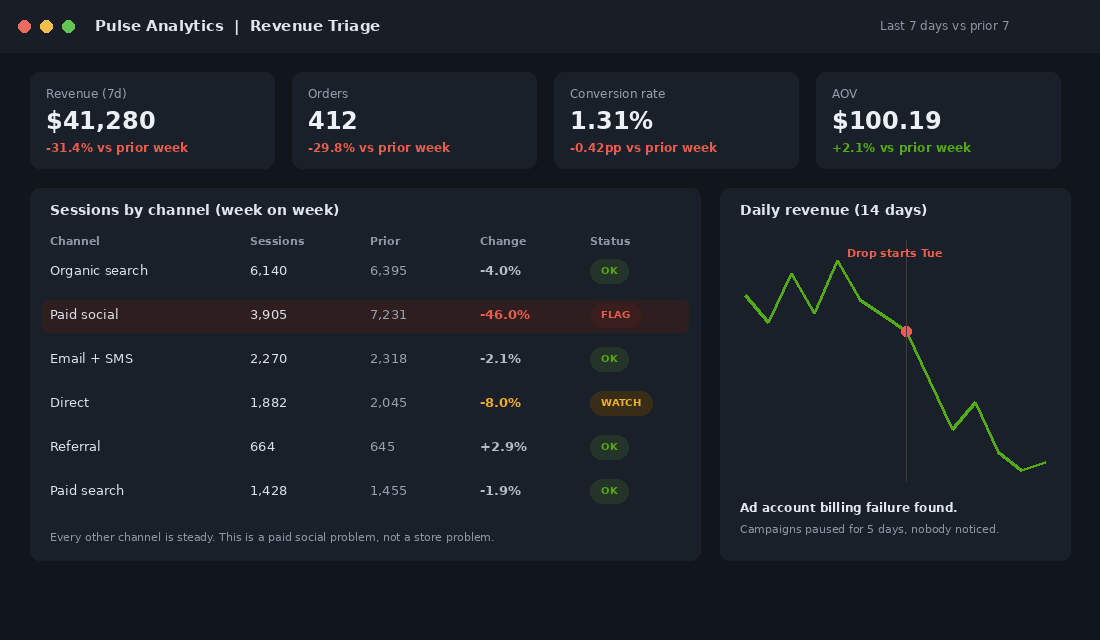
Revenue is sessions times conversion rate times average order value. Only three numbers can move. Check 2 asks: did fewer people show up? Open your Shopify sessions report (or GA4 traffic acquisition), split by channel, and compare week on week. You are hunting for the one channel that fell off a cliff while the others held steady.
Each channel fails in its own characteristic way:
- Paid social down? Look for creative fatigue first: performance marketers consistently see winning Meta creative start fading around day 11, when frequency creeps past 3 and click-through rates fall by a third or more. Then check the boring stuff, because it is boring stuff surprisingly often: a rejected ad, a hit spending cap, or a failed card payment that paused the whole account. We have seen founders lose five trading days to an expired credit card.
- Organic down? Check whether Google shipped a core update. Google rolled out three core updates in 2025, and the December one alone took 18 days to finish rolling out, moving rankings the whole time. Open Search Console, compare clicks by page and query against the prior period, and see which pages lost positions before you touch anything on the site.
- Email and SMS down? First confirm you actually sent as many campaigns as usual (calendar gaps are the number one cause). Then check deliverability: open rates falling across every campaign at once usually means you have slipped into the promotions tab or spam folder.
- Direct down? Direct traffic is mostly brand demand. If it fades, something upstream went quiet: organic social slowed, a creator stopped posting, a PR bump faded.
If traffic is the culprit, resist the urge to solve it with budget. More spend on fatigued creative buys you the same decline at a higher price. Fix the cause in the channel that broke, and measure the recovery with blended numbers rather than in-platform ROAS. Our blended ROAS playbook shows you how.
Check 3: Walk the Funnel Like a Customer
If traffic held steady but revenue fell, conversion is the leak. The median Shopify store converts around 1.4 per cent of sessions into orders, based on Littledata’s benchmark across 2,800 stores. The gap between 1.8 and 1.2 per cent does not sound like much, but it is a third of your revenue. A conversion drop with steady traffic almost always means something on the store broke, changed, or went out of stock.
Start with the funnel report: sessions, product views, add to cart, reached checkout, purchased. Compare each step against the prior period and find the stage where the cliff appears. Then do the thing that finds more bugs than any dashboard: pick up your phone and place a real order, on mobile, on 4G, with a real card. Baymard Institute’s meta-analysis of 50 studies puts average cart abandonment at 70.22 per cent, and unexpected shipping costs are the top stated reason at 48 per cent, so pay special attention to what your shipping rates are actually quoting at checkout.
The classic conversion killers, in rough order of frequency:
- A checkout or payment error. A payment gateway outage, a broken express-pay button, or a shipping zone misconfiguration that quotes $40 postage to Sydney.
- Hero product out of stock. If your top seller’s best variant is gone, conversion falls storewide because half your traffic came for that product.
- A theme or app update that broke the add-to-cart button on one browser, hid your reviews widget, or slowed the page to a crawl.
- A price or shipping change you made deliberately, without connecting it to the dip that started the same day.
This is the check with the most expensive failure mode. When Gymshark’s site went down for eight hours on Black Friday 2015, the outage cost them an estimated US$143,000 in lost sales, and founder Ben Francis wrote 2,500 handwritten apology notes to affected customers. Your version of that outage is quieter: a broken checkout that nobody notices for four days because everyone was staring at ad dashboards instead of placing a test order.
If the funnel numbers look odd but nothing is obviously broken, watch 20 session recordings of visitors who reached the cart and left. Our conversion funnel audit covers the full diagnostic if you need to go deeper.
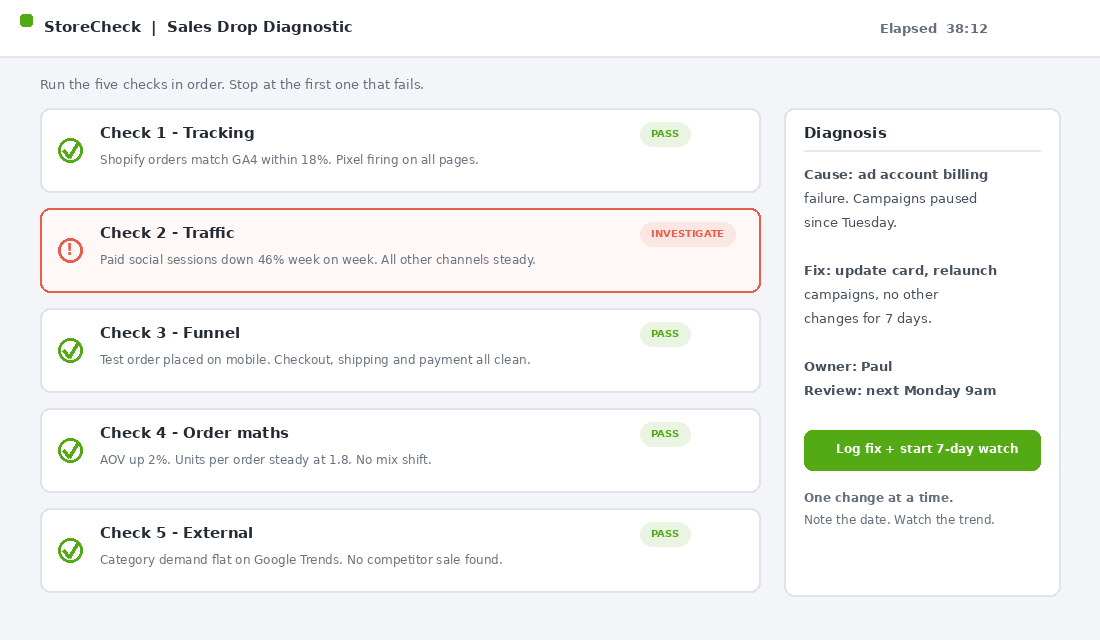
Check 4: Read the Order Maths
Sometimes traffic is fine and conversion is fine, but revenue still sags. That points at the third lever: average order value. Pull up orders and revenue side by side. If order count held but revenue fell, your customers are spending less per order, and that usually has a mechanical cause rather than a mysterious one.
- Your hero bundle or high-value variant went out of stock, so shoppers bought the cheaper single unit instead.
- A free shipping threshold changed, or a shipping app update stopped showing the “you are 12 dollars away” nudge that quietly built baskets.
- A discount code leaked to coupon sites, and a code meant for your email list is now clipping 15 per cent off half your orders.
- Product mix shifted after a sale or a viral moment pushed volume toward your cheapest SKU.
Check units per order and your product mix report for the two windows. AOV drops are usually the fastest fix on this list: restock the bundle, repair the threshold nudge, kill the leaked code. Ten-minute repairs that recover thousands.
Check 5: Look Outside the Store
If the first four checks pass, the cause probably is not you. This is where the year-on-year comparison from the start earns its keep, because the biggest external factor is simple seasonality. Australian retail has a rhythm: January sags after Christmas, July cools off after the EOFY sales rush, and October goes quiet while shoppers wait for Black Friday. If revenue is down 20 per cent on last week but level with the same week last year, you do not have a problem. You have a calendar.
Beyond seasonality, scan three things:
- Category demand. Put your two or three core category terms into Google Trends, set it to Australia, and see whether the whole category dipped with you.
- Competitor moves. A major competitor running 40 per cent off will dent your week. Check their sites and their Meta Ad Library presence before you conclude your store is broken.
- Genuine external shocks. Carrier strikes, extreme weather, even a big sporting weekend can move a category. And shocks can be existential: the cyber attack that forced Marks and Spencer to suspend online orders for weeks in 2025 ended up costing the retailer around 300 million pounds. Extreme, but a useful reminder that not every revenue story is a marketing story.
If the drop is external or seasonal, the correct response is margin discipline, not discounting into a headwind. Protect cash, keep your best channels warm, and plan the recovery push for when demand returns.
The Fix Ladder: Match the Repair to the Cause
The entire point of diagnosing before acting is that every cause has a specific repair, and applying the wrong repair makes things worse. The ladder looks like this:
- Broken tracking gets a pixel and server-side event repair. Nothing about the store or ads changes.
- Creative fatigue gets new creative, not more budget on the old creative.
- An algorithm hit gets a Search Console review and content improvements to the pages that lost, not a site redesign.
- A conversion leak gets the broken thing fixed first: checkout error, stock, speed. Optimisation comes later.
- An AOV sag gets a restock, a threshold repair, or a code cleanup.
- A seasonal or external dip gets patience, margin protection and retention work, which costs far less than buying traffic into weak demand.
Then the discipline that separates operators from gamblers: change one thing, write down the date, and watch the 7-day trend before touching anything else. If you change five things, you learn nothing, and the next dip owns you all over again.
Why Panic Discounting Is the Worst First Move
The 20 per cent off flash sale is the most common response to a sales dip, and it is nearly always the most expensive. Run the maths on a store with a 30 per cent gross margin: on a 100 dollar order you normally keep 30 dollars. Take 20 per cent off the top and you keep 10. You now need three times the volume just to bank the same dollars, on a week when demand is already soft.
And that is the good scenario. The discount also trains your list to wait for the next panic, pulls forward orders you would have won at full price, and, worst of all, masks the real cause. If the actual problem was a broken checkout button on Safari, your sale bought you a mediocre week and left the bug in place. The dip comes back the moment the sale ends, except now your margin is thinner and your customers are conditioned.
Discounts are a tool for planned campaigns with planned margins. They are not a diagnostic instrument.
Build Your Early Warning System in 15 Minutes
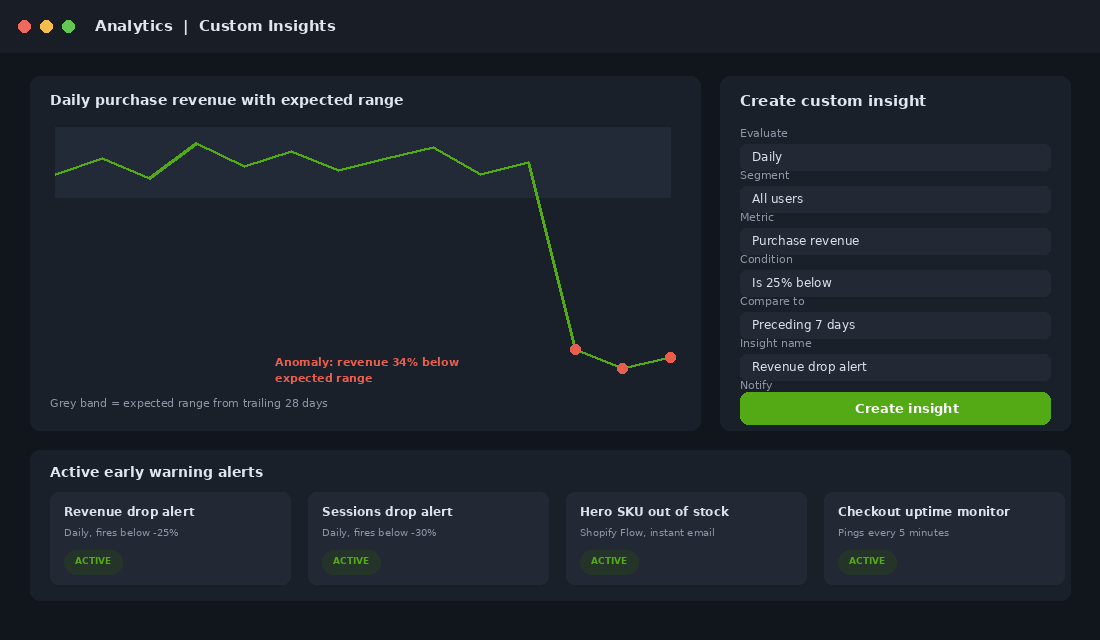
The founders who handle dips best are the ones who hear about them on day one, not day five. You can build a serviceable early warning system this afternoon, for free, with GA4 custom insights. Here is the setup:
- Step 1: Open GA4, go to Reports, then Reports snapshot, and scroll to the Insights card. Click View all insights, then Create.
- Step 2: Choose Custom insight and set evaluation frequency to Daily.
- Step 3: Set the metric to Purchase revenue and the condition to a percentage decrease of 25 per cent versus the preceding 7 days.
- Step 4: Name it “Revenue drop alert” and add your email under notifications.
- Step 5: Duplicate it for Sessions with a 30 per cent threshold, so you can tell a traffic drop from a conversion drop before you even open the laptop.
Back it up with two Shopify-side alarms: a Shopify Flow workflow that emails you the moment a hero SKU hits zero stock, and a free uptime monitor pinging your checkout every five minutes. If you want the paid version of all this, tools like Triple Whale and Polar Analytics bundle anomaly alerts with attribution, but the free stack above catches the majority of expensive surprises.
The Compound Effect: From Three Weeks of Guessing to One Hour of Knowing
Here is why this system matters more than any single tactic in it. A store doing 2 million dollars a year averages about 5,500 dollars a day. A 30 per cent dip is roughly 1,650 dollars a day walking out the door. The founder who diagnoses the cause in an hour and fixes it inside two days loses maybe 3,000 dollars. The founder who guesses, discounts, redesigns and waits loses three weeks of it, call it 30,000 dollars, plus the margin they burned on the panic sale, plus a customer list that now expects discounts.
Most stores eat two or three meaningful dips a year. The diagnostic does not prevent them. It compresses them. Over a year, the difference between panic and process on a 2 million dollar store is comfortably 50,000 dollars or more, and the founder with the process sleeps better every single week in between, because the alerts are standing watch.
The Four Mistakes Founders Make When Sales Dip
- Discounting before diagnosing. You would not take painkillers for a broken arm and call it treated. Find the cause first. The discount is almost never the matching repair.
- Changing five things at once. New creative, new homepage, new offer, new budget, all in one week. Sales recover and you have no idea why. The next dip starts the panic from zero.
- Blaming the algorithm without opening the data. “Meta is broken” and “Google hates us” are feelings, not findings. The channel report, Search Console and the Ad Library turn feelings into findings in 20 minutes.
- Waiting a month to see if it comes back. Hope is not a diagnostic. If the 7-day trend is down and it survives the year-on-year check, run the five checks today. Every day of waiting has a dollar figure attached.
The 60-Minute Sales Drop Diagnostic Checklist
Save this. Next time the Tuesday number makes your stomach drop, set a timer and work the list:
- Minutes 0 to 10: Reality check. 7-day rolling revenue versus prior 7 days, and versus the same week last year. Strip one-off orders. Confirm the drop is real.
- Minutes 10 to 20: Tracking. Shopify orders versus GA4 purchases versus pixel events. If Shopify is steady, fix tracking and stop here.
- Minutes 20 to 35: Traffic. Sessions by channel, week on week. Find the quiet channel. Check ad account status, billing, rejected ads, Search Console, and your own send calendar.
- Minutes 35 to 50: Funnel. Funnel report step by step, then place a real test order on your phone. Check hero stock, shipping quotes, payment options and page speed.
- Minutes 50 to 55: Order maths. AOV, units per order, product mix, active discount codes.
- Minutes 55 to 60: Outside. Google Trends for the category, competitor sales, seasonality against last year.
- Then: one fix, matched to the cause, dated in a log, watched for 7 days. No panic discounts.
One hour. Five checks. One fix. That is the whole system.
Inside eCommerce Circle, reading your numbers like this is one of the core skills we build with every member, because a founder who can diagnose a dip in an hour runs a calmer, more profitable store than one who guesses. If you want a second opinion on what your dashboard is telling you, let’s talk.