You scaled spend last month. Meta Ads Manager said 4.2x, Google reported 3.8x, and Klaviyo claimed another slice on top. On paper, every channel was winning. Then the EOFY numbers landed, your accountant ran the real margin, and the bank balance told a different story. The ads “worked” and the profit quietly disappeared.
What’s in This Article
That gap is not bad luck, and it is not your media buyer going soft. It is what happens when you run a multi-channel Shopify store on numbers that each platform marks for itself. Add up what Meta, Google, TikTok and email all claim, and you will over-count your real revenue by anywhere from 30 to 100%. Every channel is taking credit for the same Aussie shopper who saw three ads and an email before they checked out.
The brands that scale past $100k a month without hitting the profit cliff stopped trusting platform ROAS a long time ago. They run on one number that cannot be gamed: blended ROAS, also known as your marketing efficiency ratio, or MER. This playbook gives you the exact 5-number system to set it up, the break-even line that tells you when to push and when to pull, and the weekly habit that keeps your ad spend honest.
Why Platform ROAS Stops Telling the Truth the Moment You Scale
Here is the uncomfortable truth most founders learn too late. Every ad platform is built to claim conversions, because claiming conversions is how it justifies your next dollar of budget. Meta wants the credit. Google wants the credit. Both will happily take it for the same sale.
This got dramatically worse after Apple’s iOS 14.5 tracking changes in 2021. Meta lost a big chunk of direct signal and started modelling conversions instead of measuring them. So now you have one platform estimating, another platform estimating, and an email tool counting any sale that follows a click. Add those dashboards together and the total will comfortably exceed what actually hit your Shopify account.
It cuts both ways too. Misconfigured tracking can underreport conversions by 20 to 30%, which sends panicked founders switching off campaigns that were actually working. The point is simple: every single platform number is an estimate fighting for your budget. None of them is the truth.
When you are tiny and running one channel, this barely matters. The moment you run Meta plus Google plus TikTok plus email, the double-counting compounds fast. It is why so many brands hit a profitability cliff around $500k a month in revenue: that is the point where the attribution maths finally catches up with the bank account.
Blended ROAS and MER, Explained Without the Jargon
Blended ROAS is your total revenue divided by your total ad spend across every channel, for a set period. MER is the exact same ratio, usually framed as the weekly or monthly business-level number. Same maths, different desk. Performance marketers say ROAS, finance people say MER, and they are arguing about the same fraction.
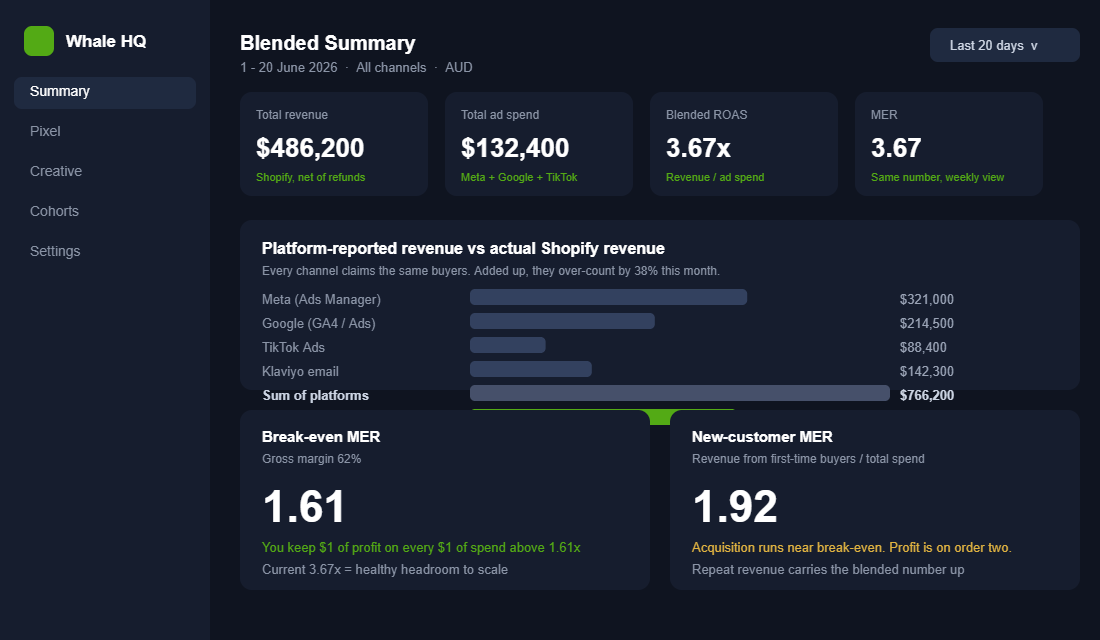
Work it with real numbers. Say last month you did $486,200 in Shopify revenue and spent $132,400 across Meta, Google and TikTok combined. Your blended ROAS is 3.67x. There is no attribution argument to be had. It does not matter which platform “deserves” the sale, because you are dividing the only revenue figure that is real by every dollar you spent to earn it.
That is why blended ROAS cannot be gamed. A channel can inflate its own ROAS by harvesting people who were going to buy anyway. It cannot inflate the total that landed in your account. If you want to close the tracking gaps that make platform numbers so unreliable in the first place, start with the Shopify Conversion Tracking Playbook, then layer blended ROAS on top as your source of truth.
For context on where you should land: the average ecommerce ROAS in 2025 sat around 2.87x. In 2026, platform medians are roughly 1.9x on Meta and 3.7x on Google. For a healthy Aussie DTC brand, a blended ROAS or MER between 3.0 and 5.0 is the zone you are aiming to live in. Below 3.0 and your marketing usually is not efficient enough to scale. Above 5.0 and you are probably under-investing and leaving growth on the table.
The Number That Actually Pays Your Rent: Break-Even MER
A ROAS target on its own is meaningless. A 3x can be wildly profitable for one brand and a slow death for another, and the only thing that decides which is your gross margin. So before you set any blended target, calculate your break-even MER.
The formula is one line: break-even MER = 1 divided by your gross margin percentage. If your gross margin is 62%, your break-even MER is 1.61x. Below 1.61x you lose money on every order you advertise into. Above it, every extra dollar of efficiency is profit on the marketing line.
- 50% gross margin. Break-even MER is 2.0x. You need to double your spend in revenue just to stand still.
- 62% gross margin. Break-even MER is 1.61x. Healthy headroom, which is why a 3.67x blended feels comfortable.
- 70% gross margin. Break-even MER is 1.43x. This is the beauty and supplement maths that lets brands outspend everyone.
- 40% gross margin. Break-even MER is 2.5x. Common for apparel and homewares, and the reason those founders feel the squeeze first.
This is exactly where Aussie shipping and returns quietly bite. Free shipping across the country and a generous 30-day returns window drag your true margin down, which lifts your break-even MER without you noticing. If you have not nailed down your real per-order economics yet, work through the Shopify Contribution Margin Playbook first. Your break-even MER is only as honest as the margin you feed it.
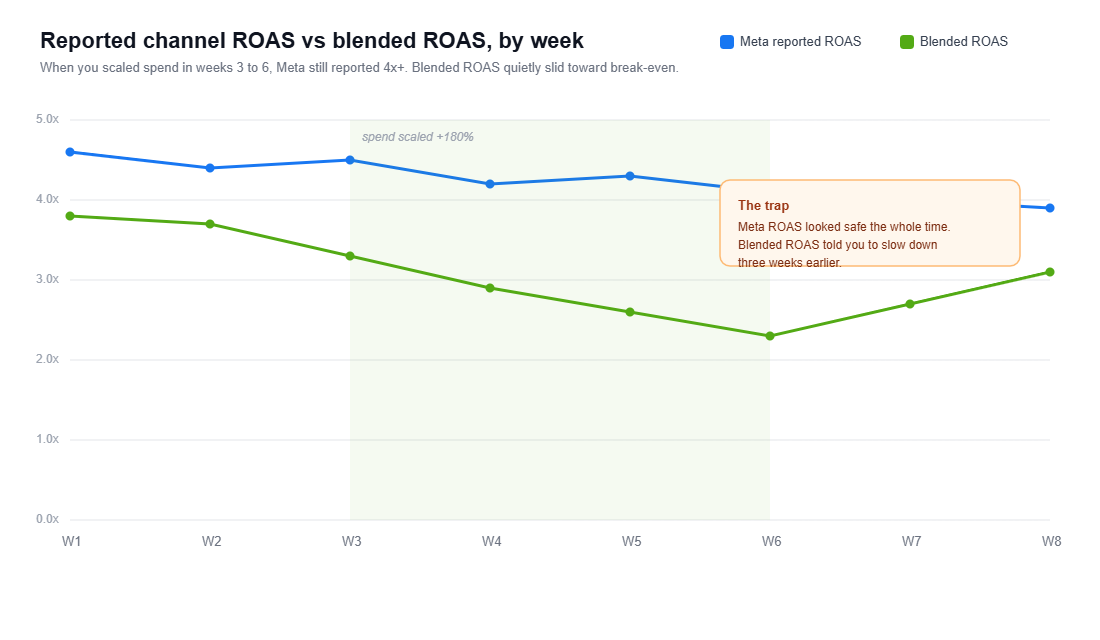
That chart is the trap in one picture. When this brand scaled spend by 180% across weeks three to six, Meta kept reporting north of 4x and everyone felt safe. Blended ROAS, meanwhile, slid from 3.3x toward break-even. The platform number said push. The honest number said stop. The founders who only watch platform ROAS find this out a month later, when the profit is already gone.
The 5-Number Weekly Dashboard You Should Be Running
You do not need a 40-metric dashboard. You need five numbers, reviewed every Monday before you touch a single ad. This is the framework we put in front of members, and it fits on one screen.
- 1. Total revenue. Your Shopify revenue for the period, net of refunds. The real number, not a platform estimate.
- 2. Total ad spend. Every platform added together for the same period. Meta, Google, TikTok, anything paid.
- 3. Blended ROAS (MER). Number one divided by number two. This is your headline efficiency.
- 4. New-customer MER. Revenue from first-time buyers divided by total spend. This isolates acquisition.
- 5. Contribution after ad spend. The actual dollars of profit left once product, shipping and ads are paid. The number that feeds your bank account.
The rule that runs off it is just as simple. If number three sits above your break-even and number five is growing, push more budget in. If number three drops below your floor (set it at 3.0 for most brands) for two weeks running, pull back and fix the creative or the offer before you add another dollar. You do not buy your way out of an efficiency problem.
New-Customer MER: The Metric That Separates Real Growth From Recycled Spend
Here is the sneaky failure mode that a healthy blended ROAS can hide. If your repeat buyers are propping up the number, you might be paying ad budget to re-buy customers you already had. The blended figure looks great while your acquisition engine quietly stalls.
New-customer MER fixes that. It divides revenue from first-time buyers by your total ad spend, so you can see acquisition on its own. If it is running near break-even, you are making your profit on order two, not order one. That is completely fine if your retention is strong, and a flashing red light if it is not.
This is why retention and acquisition have to be read together. The cleanest way to know whether your second-order economics can carry near break-even acquisition is to read your retention curves directly, which is exactly what the Shopify Cohort Analysis Playbook walks you through. Blended ROAS tells you the business is efficient. New-customer MER plus cohorts tell you whether that efficiency is real growth or recycled spend.
The data backs the discipline. Brands growing 30% or more year on year ran a median blended ROAS of around 3.8x, while brands that had plateaued or gone backwards ran about 2.1x. The gap between them was rarely a clever new channel. It was acquisition discipline and a refusal to scale spend into a falling blended number.
How to Set This Up This Week
You can have this running before next Monday. The fastest path is a dedicated analytics layer, and the one most Aussie DTC brands reach for is Triple Whale. Here is the setup, start to finish.
- Install and connect Shopify. Add Triple Whale from the Shopify App Store and connect your store so it pulls real revenue, orders and refunds.
- Connect every ad account. Link Meta, Google and TikTok so total ad spend is pulled automatically. Manual spend can be added for anything off-platform.
- Connect Klaviyo. So email and SMS revenue sit in the same view instead of being claimed twice.
- Enter your COGS and shipping. This is the step founders skip, and it is the one that turns ROAS into real net profit. Feed it accurate numbers.
- Build your Summary view. Pin blended ROAS, MER, new-customer metrics and net profit so the five numbers are the first thing you see.
- Add a post-purchase survey. A “how did you hear about us” survey through Fairing or KnoCommerce gives you a human cross-check on Meta underreporting, which is the single most distorted platform number.
Not ready to pay for a tool? Do not let that stop you. A single Google Sheet beats a pretty dashboard you never open. Each Monday, drop in your Shopify revenue, sum your platform spend, and divide. Five honest minutes a week will change more decisions than any amount of staring at Ads Manager.
It works at real scale too. One documented brand running around $110k a month in ad spend held a 2.52x blended ROAS across six months and stayed profitable the whole way, precisely because they cross-checked Meta against post-purchase surveys instead of trusting the dashboard. The number was lower than Meta claimed, but it was true, and true is what you can scale on.
What Good Looks Like at Your Revenue Stage
A 3.0x blended ROAS is not a universal pass mark. What counts as healthy shifts as you grow, because bigger brands carry more brand demand, more repeat revenue and more fixed overhead that the marketing line has to help cover. Use these stage benchmarks as a sanity check, not a law.
- Under $1m a year. You are mostly single-channel and acquisition heavy. Expect a leaner blended number and protect cash above all else.
- $1m to $5m. Brands here commonly run a blended MER of 1.5 to 2.5 as they pour fuel into acquisition. Tight, but fine if your margins and retention support it.
- $5m to $10m. The healthy band lifts to roughly 2.5 to 3.5 as repeat revenue starts doing real work.
- $10m to $25m. Expect 3.0 to 4.5, with brand demand and email carrying a larger share of the total.
Notice the pattern. The number that feels scary at $2m is the number you grow into at $10m. The mistake is benchmarking against another brand’s screenshot on Twitter instead of against your own break-even and your own last quarter. Your history is the only fair comparison, because only you know your true margin and your real shipping cost into regional Australia.
Three Mistakes That Make Blended ROAS Lie to You Too
Blended ROAS is honest, but you can still feed it dishonest inputs. Three errors quietly corrupt the number, and all three are common in stores doing six and seven figures.
- Counting gross revenue, not net. If you forget to strip refunds and returns, your blended ROAS reads high while your bank account reads low. Always use revenue after refunds, especially with a 30-day returns window.
- Forgetting agency and creative costs. Total ad spend is not just media. If you pay a media buyer, an agency retainer or a UGC creator, that is part of your true marketing cost and belongs in the denominator.
- Mixing your time periods. Revenue this week against spend last week will flatter or punish you for no reason. Lock both numbers to the exact same window before you divide.
Fix those three and your blended number stops being a vanity metric and starts being a decision tool. The discipline is boring, which is exactly why most brands skip it and keep arguing with Ads Manager instead. Spend twenty minutes once to set the inputs up properly, and the number stays trustworthy for the life of the store. That is a rare return on twenty minutes.
The Compound Effect: When Your Whole Team Runs on One Number
The real shift is not the metric. It is what happens to your decisions when everyone is looking at the same honest number. Your media buyer can still optimise inside Meta on platform ROAS and CPA, because that is the right lens for tuning campaigns. But the budget decision, the one that actually risks your cash, gets made on blended ROAS.
That ends the weekly argument. No more “but Meta says 4x” while the bank says otherwise. Break-even MER tells you the floor. The five numbers tell you the current state of the business. New-customer MER tells you whether the growth is real. Each piece answers a different question, and together they form a single operating rhythm that runs every Monday.
Look back at the tracker. The EOFY week saw volume jump hard while blended ROAS held its line. A founder watching only revenue would have celebrated. A founder watching only platform ROAS would have missed it entirely. A founder running the five numbers knew it was a genuine win, banked the profit, and scaled into it with confidence instead of hope.
That is the whole game. Stop optimising for the number each platform wants you to see. Start running your store on the one number that pays you.
Inside eCommerce Circle, getting your numbers honest is one of the first things we work on with every member, because Profit is one of the core pillars of the More Orders operating system and blended ROAS is where it starts. If you want a second opinion on yours, let’s talk.