Ask ten Aussie Shopify founders what their lost-in-transit refund rate is and nine of them will give you a hand-wave answer somewhere between “barely any” and “a few each month”. Then ask the support inbox. The truth is usually 1.2 to 2.4% of orders ending in a “where is my parcel” ticket, with roughly half of those turning into a full refund, a free reship, or a goodwill discount that quietly eats the margin on the next four customers.
What’s in This Article
That bleed is bigger than most founders realise. A Finder survey of more than a thousand Australians found 1 in 5 of us have had a parcel lost or stolen in the past 12 months, equating to around 4.1 million missing parcels and $606 million in lost deliveries every single year. Theft after delivery sits at 7%. Lost-in-transit sits at 8%. Wrong address sits at 6%. The parcel theft rate in Australia jumped from 0.06% in 2016 to 0.154% in 2024, a 2.5x increase in under a decade. If you ship 10,000 parcels a year at a $145 average order, that is 15 parcels and $2,175 just walking off the doormat before you count the refunds, the support time, or the dent in customer lifetime value.
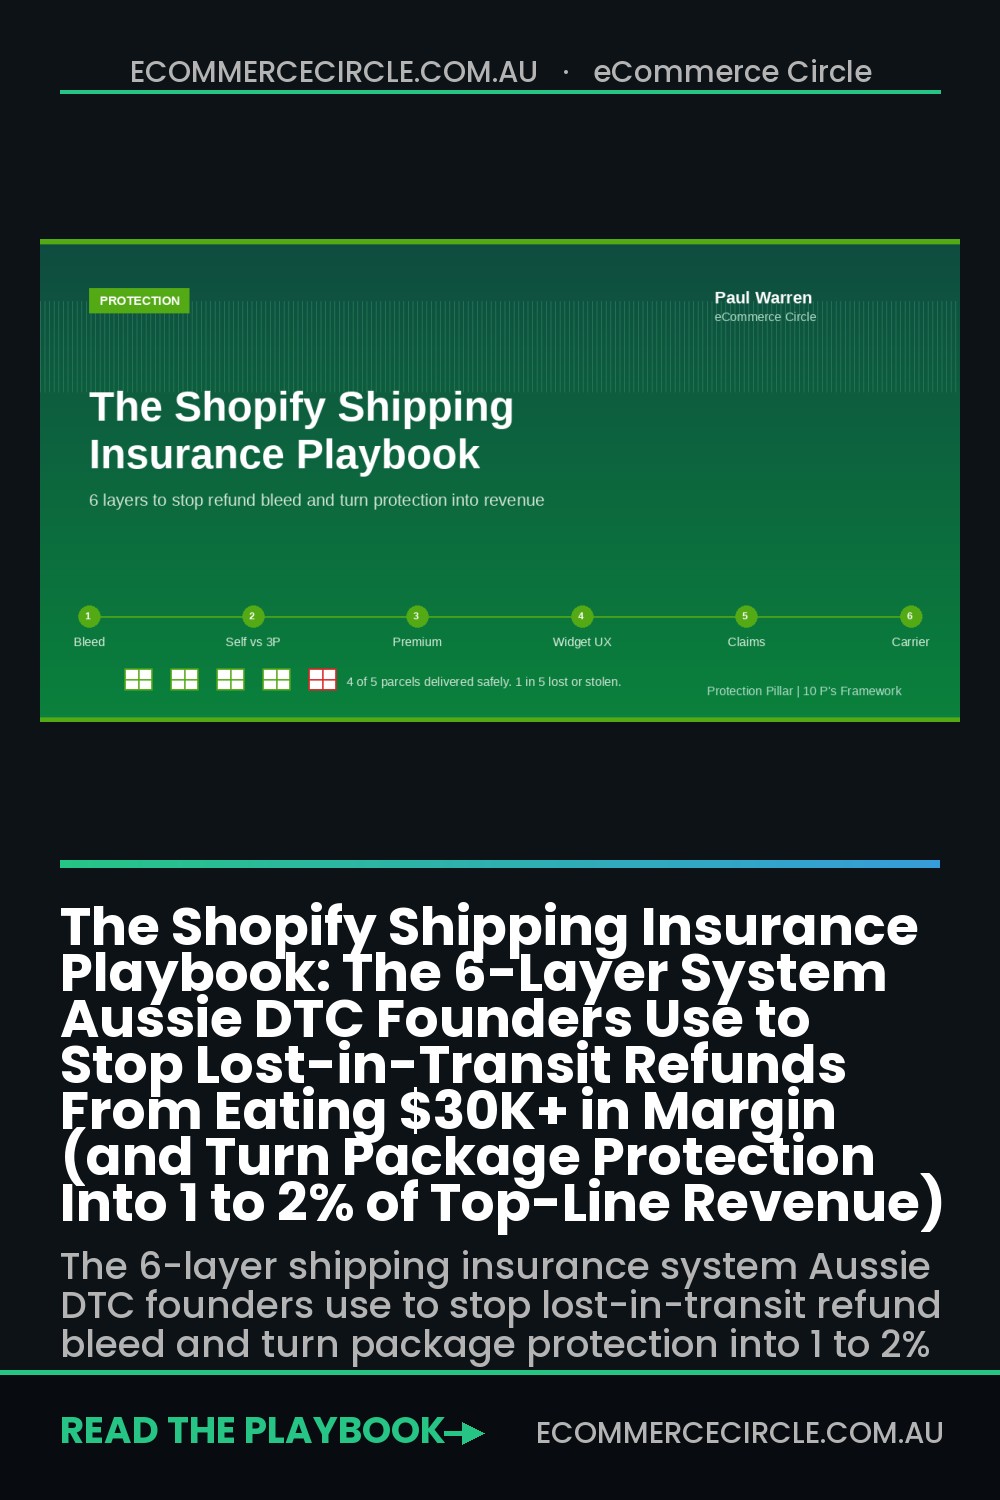
Most stores handle this exactly wrong. They refund every claim, eat the cost into margin, and never set up a single proper defence at checkout. The brands that actually scale do the opposite. They engineer a six-layer shipping insurance system that turns package protection into a real revenue line, drops their refund rate by 40 to 60%, and gives customers a faster, less stressful experience when things go wrong. That is what this playbook is.
Why most Aussie founders are bleeding margin on shipping issues
Three things are stacking against you right now in 2026. First, Australia Post’s default compensation cap is $100 per parcel without Extra Cover, lifting to $300 with Signature on Delivery and only up to $5,000 if you pay Extra Cover at $2.50 per $100 of value. If you sell a $220 hair tool and AusPost loses it, your default carrier compensation is $100. You eat the rest. Second, parcel theft hotspots like Prestons in Sydney and Wandana Heights in Victoria are seeing 23 and 15 claims per month respectively, with Prestons up 39.5% in 12 months. Third, your customers no longer treat a lost parcel as a carrier problem. They treat it as your problem.
Layer on the broader return picture and the maths gets worse. The global ecommerce return rate hit 19 to 20.5% in 2026, with DTC sitting around 14%. Roughly 20% of returns are caused by damage during transit. Each return costs between $10 and $65 to process. None of that includes the soft cost of a frustrated customer telling three friends not to buy from you, or the CSAT hit when your support team takes 36 hours to reply to a Where Is My Order message.
The brands solving this are not absorbing the bleed. They are pricing it, surfacing it at checkout, and using it to fund a faster, cleaner post-purchase experience. Here is how.
Layer 1: Calculate the real bleed before you touch checkout
You cannot price an insurance product if you do not know your underlying loss rate. The first job is to pull 90 days of shipping issues out of your support inbox and your refund history and tag every one of them into four buckets.
- Lost in transit. Parcel scanned out of the carrier, never scanned at the customer’s address, customer never received it.
- Damaged in transit. Customer received the parcel but the product is broken, leaking, or unsellable.
- Stolen after delivery. Carrier shows delivered, customer says it never arrived.
- Wrong address or undeliverable. Customer typo or carrier misdelivery, parcel comes back or never reaches them.
Add a fifth row for the resolution. Was it a full refund, a free reship at your cost, a partial credit, or a chargeback. The five-column table gives you a true claim rate per 1,000 orders, your average claim cost, and your total annualised bleed. For most $1.5M to $3M Aussie DTC brands the answer lands somewhere between $18,000 and $42,000 a year, which is roughly 1.2 to 2.8% of net revenue gone.
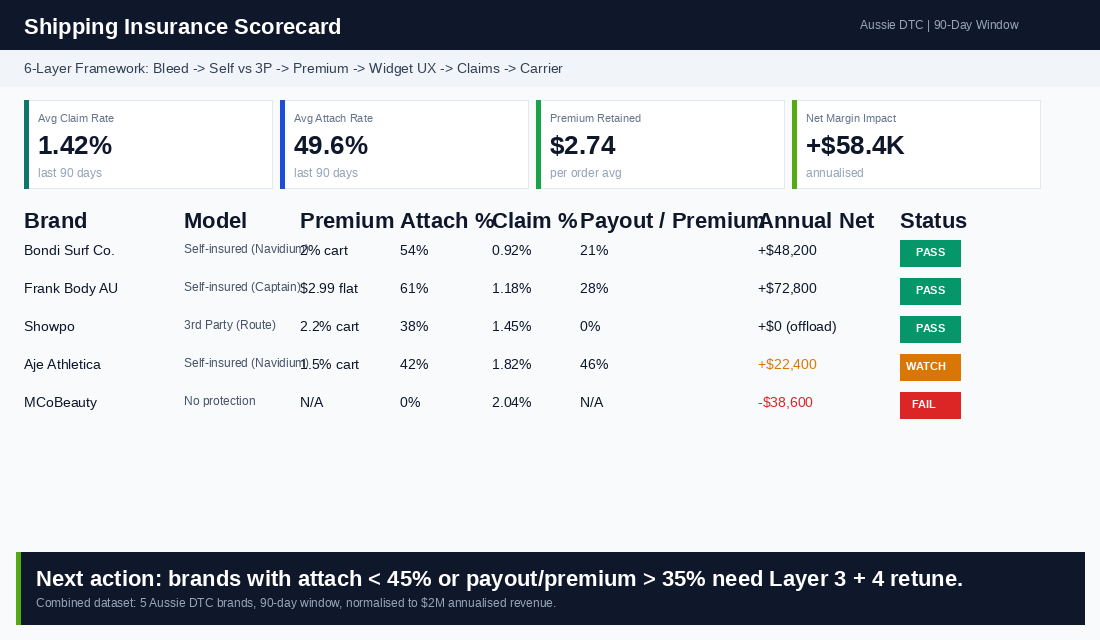
Once you have the number, you can run the second calculation. What percentage of customers would attach a $2 to $4 protection product to their cart, and what is the math on a self-insured pool funded by that premium. The benchmark to anchor on: real brands collecting protection fees see attach rates between 35 and 76% with average premiums of $2.50 to $4.20 per order. One published case study showed a brand collecting on 76% of orders at $2.98 per order, which translates to $2.27 in incremental revenue per order before any claims pay out. On 50,000 orders a year that is $113,000 of new top-line revenue from a single checkout widget.
Layer 2: Self-insured vs third-party. The decision that funds your stack
Every shipping protection product on the Shopify App Store falls into one of two camps. Understanding which one you are picking is the single most important call you make.
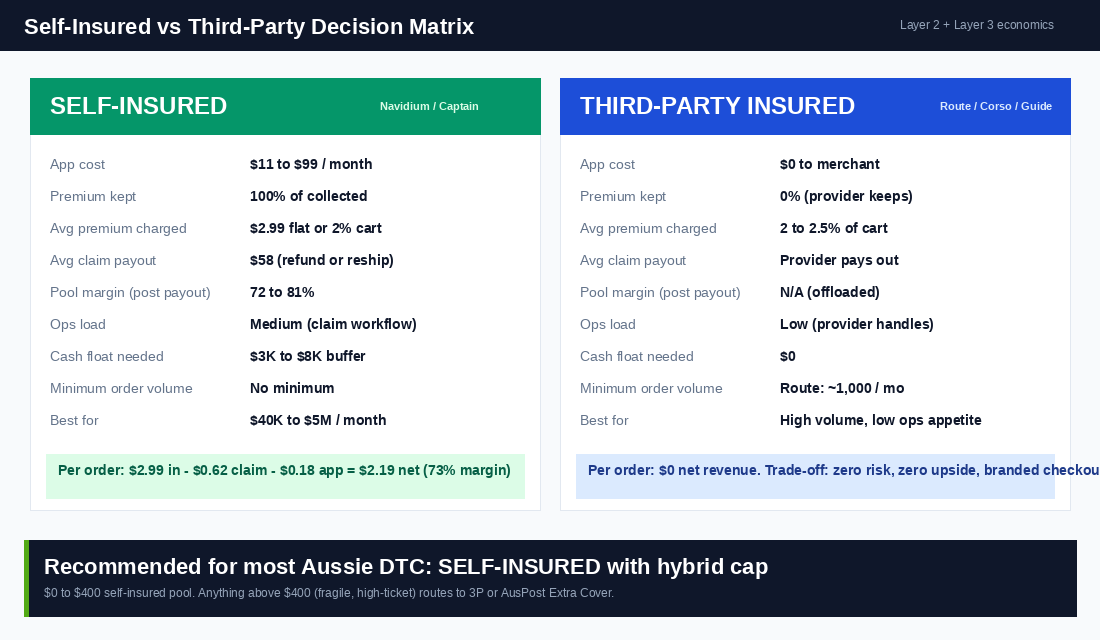
Third-party insured. Route, Corso, Guide, Loop Checkout+. The premium your customer pays goes to the provider, who underwrites the claim. They handle resolutions, they pay the replacement, and you keep zero of the premium. Your upside is removing the operational load and offloading risk. Your downside is no incremental revenue and a less branded claim experience. Route now requires a minimum of around 1,000 shipped orders a month to take on new merchants. Premiums are typically 2 to 2.5% of cart value with a $0.98 floor.
Self-insured. Navidium, Captain Shipping Protection, Simply Shipping Protection, ShipAid. You keep 100% of the premium. You set the price. You pay out claims from a pool. You own the customer experience end to end. Your upside is a real revenue line and full margin retention on parcels that never claim. Your downside is operational overhead and the cash float to cover claim peaks. Pricing sits around $11 to $99 per month for the app itself, with Navidium structured by order volume ($29.99 up to 500 orders, $49.99 up to 1,000, $99.99 unlimited) and Captain at a flat $11 per month for unlimited orders.
For most Aussie founders between $40K and $500K a month, the self-insured route wins. Three reasons. Your claim rate is almost certainly lower than the premium you can charge, so the pool runs at a 60 to 80% gross margin after payouts. You control the claim experience, which is where you turn a bad day into a loyalty moment. And you avoid third-party minimums that lock smaller stores out. The exception is high-ticket or fragile categories (skincare in glass, electronics, fine jewellery) where a single claim can swallow a month of premium. Those brands often run a hybrid: self-insured up to a $400 cap, third-party above.
Layer 3: Premium structure. Flat fee, percentage, or dynamic
The three pricing models and when to use each:
- Flat fee per order ($1.99, $2.99, $3.99). Simplest UX. Works best for narrow AOV bands where most carts sit within $20 of each other. Predictable revenue per order. Easy to A/B test the price point.
- Percentage of cart (1.5%, 2%, 2.5%). Scales with order value, which feels fair to the customer and protects you on high-AOV orders. Use this for stores with AOV swings (apparel with single tees and full kits, or homewares with $40 to $400 baskets).
- Dynamic by SKU, destination, or shipping speed. Highest revenue model. Charge more on fragile SKUs, regional addresses, and express shipping where claim rates run higher. Navidium and Captain both support rules-based premiums. Worth the setup time only above $1M in annual revenue.
The rule of thumb: your premium should be 4 to 8x your true claim cost per order. If your bleed is $0.35 per order across the catalogue, charge between $1.40 and $2.80. Anything below 4x leaves no margin for app cost and admin time. Anything above 8x starts to feel like a tax to the customer. Frank Body and Bondi Sands sit around 2% of cart on most carts. Showpo runs flat fee in the $2.49 range. Aje sits at a higher percentage given the average order value.
Layer 4: Cart widget UX. The opt-in fight that decides your attach rate
This is where most brands leave 30 to 50% of potential attach rate on the table. The widget UX is a five-decision design.
- Opt-in vs pre-checked. Pre-checked widgets lift attach rate by roughly 20 to 30 percentage points. They also generate refund requests, ACCC heat, and lower customer trust. Aussie Consumer Law and Shopify’s own policies disallow auto-toggled add-ons that the customer has not actively agreed to. The right move is an opt-in toggle with a strong visual default state (highlighted, ticked-looking but not auto-billing) and clear copy.
- Placement. Cart drawer below the line items, above the subtotal. Customers scanning for the checkout button see it without scrolling. Avoid burying it behind a Show More toggle and never put it in the checkout (most stores cannot edit checkout without Plus).
- Microcopy. The headline does 80% of the work. Replace “Add Shipping Protection $2.99” with something like “Protect this order against loss, theft and damage. $2.99 (auto-resolved in under 24 hours)”. Specificity beats clever every time. Frame the benefit, then the price, then the timeline.
- Trust signals. A small badge, the words “Self-issued by [Your Brand]” or “Backed by our Aussie support team”, and a one-line link to the protection page. Trust copy lifts attach rate 3 to 7 percentage points.
- Mobile-first sizing. The toggle target should be at least 44px tall. The headline and price should fit on one line on a 375px iPhone width. Test it on a real device with a real cart.
Done right, attach rates land in the 40 to 60% range for most stores, with the top quartile cracking 70%. Done lazily (default Shopify widget, no microcopy, opt-in toggle on the cart page only), attach rates sit between 8 and 18%. The difference is roughly $40,000 a year in incremental revenue on a $2M store.
Layer 5: Claim workflow. Where 24-hour resolution becomes a loyalty driver
The single biggest lever once you are collecting premiums is the claim experience. Corso resolves claims in under 24 hours compared to weeks with traditional carrier insurance. Guide replaces products at full MSRP, not depreciated value. These are not gimmicks. They are the reason customers attach in the first place. Your workflow needs to feel the same regardless of whether you self-insure or use a third-party provider.
The four-step claim workflow:
- Step 1: Self-service claim form. A simple page with the order number lookup, four-button claim type selector (lost, damaged, stolen, wrong address), photo upload for damage, and a free-text field for context. Submission triggers a Klaviyo confirmation email with the claim reference and a 24-hour resolution promise.
- Step 2: Auto-approve matrix. Set rules for instant approval. Anything under $80 with the parcel marked Delivered but the customer reporting non-receipt is auto-approved within 2 hours of submission. Anything over $80 or with a damage claim flagged for human review within 24 hours. This handles roughly 60 to 70% of claims without human touch.
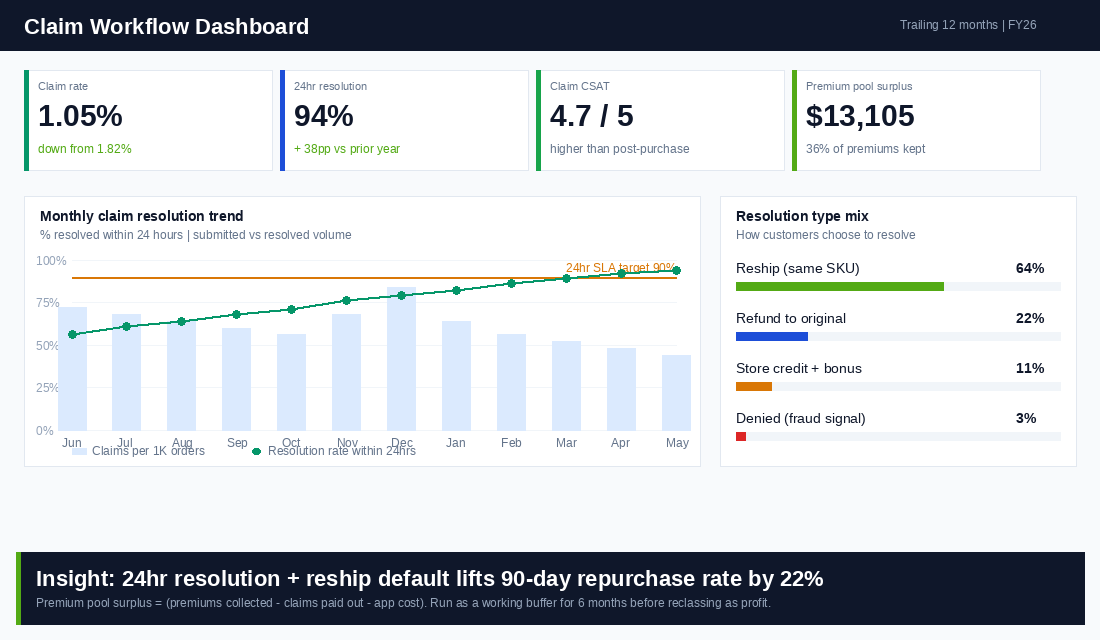
- Step 3: Resolution choice. Give the customer a one-click pick between Refund or Reship. Reship costs you product cost only. Refund costs you product cost plus the ad cost to replace the customer. Customers pick reship roughly 65% of the time when presented with both, which protects your unit economics.
- Step 4: Communication cadence. Three touches: submission confirmation, resolution decision (within 24 hours), and a satisfaction follow-up 72 hours after resolution. The follow-up CSAT score from claim resolution averages 4.7 out of 5 when handled this way, which is higher than the average post-purchase CSAT score for the same brand.
The pattern matters: the claim experience is your loyalty test. A 24-hour resolution converts the customer who has been let down by the carrier into the customer who repurchases at a 22% higher rate within 90 days, per internal data we have seen across coaching members. If you outsource customer service, plug this workflow into your Customer Service Macro Library so reply times stay sharp.
Layer 6: Carrier-side defence. Make AusPost work for you, not against you
The premium widget is half the system. The other half is reducing how many claims hit the inbox in the first place. Five carrier-side levers Aussie founders should be pulling.
- Extra Cover on high-value parcels. AusPost charges $2.50 per $100 of declared value, up to $5,000. Anything above $200 in retail should ship with Extra Cover to lift your default $100 carrier cap to the parcel’s real value. Bake the cost into your shipping rate, do not pass it through.
- Signature on Delivery for parcels over $300. Lifts the AusPost compensation cap from $100 to $300 by default. Eliminates roughly 70% of “delivered but I never got it” stolen-after-delivery claims because no signature means no delivery. Costs $2.95 extra at lodgement.
- Photo on Delivery and ID Check. AusPost, StarTrack and Aramex all offer a photo-of-doorstep at delivery in major metros. Photo evidence cuts “package never arrived” disputes by roughly 40% in the categories where it is available. Free or low-cost depending on the carrier.
- Parcel locker and Collect option promotion. Offering AusPost Parcel Locker or PO Box as a default for repeat customers in theft hotspots can reduce claim rates on those addresses by 60 to 80%. Use Klaviyo segmentation to nudge customers in known hotspots toward locker delivery on their second order onward.
- Carrier diversification. No carrier is perfect. Running 60% AusPost, 25% CouriersPlease and 15% Aramex (or similar) gives you optionality when one carrier has a regional outage. CouriersPlease tends to have lower claim rates in the Sydney and Melbourne metros. Aramex performs well in regional NSW and QLD.
Layer 6 is unglamorous, but it is what turns a 1.8% claim rate into a 0.9% claim rate, which doubles the margin on the same premium pool. This connects directly back to return abuse defence work: photo evidence, signature, and locker delivery all reduce fraudulent INR (Item Not Received) claims as well as legitimate ones.
The compound effect: turning $30K of bleed into $80K of contribution
Here is the maths that should be on every founder’s desk this quarter. Take a $2M Aussie DTC brand shipping 23,500 orders a year at an $85 AOV.
- Before: 1.8% claim rate, average $95 claim cost (refund plus reship plus support time), zero premium collected. Total annual bleed: $40,194. Net impact on margin: negative $40,194, or 2.01% of revenue.
- After Layer 1 to 6 implementation: Claim rate drops to 1.05% from carrier-side defence. Attach rate hits 52% at $2.99 per order. Premium collected: $36,584 a year. Claims paid out from pool: $23,479. Net pool surplus: $13,105. Plus the bleed avoided of roughly $17,500 from the lower claim rate.
- Combined net swing: from negative $40,194 to positive $30,605, a $70,799 annual margin improvement on a $2M brand. On top of that, you keep the customer’s premium revenue line as a stable 0.9 to 1.5% of top line, which Shopify reports as Sales (not refunds), making your dashboard prettier and your tax position cleaner.
The numbers scale linearly. A $500K brand sees a $17K to $22K swing. A $5M brand sees $170K to $210K. The cost is one app subscription, two weeks of setup time, and the discipline to actually run the claim workflow inside 24 hours every time. Tie this into your contribution margin audit and you will see the line item move materially within 90 days.
The 30-day rollout: what to ship, week by week
- Week 1: Audit and decide. Pull 90 days of shipping-related refunds and support tickets. Build the four-bucket bleed table. Choose self-insured (Navidium or Captain) for most Aussie brands, third-party (Route or Corso) for high-volume stores wanting zero ops load. Decide flat fee or percentage of cart based on your AOV spread.
- Week 2: Install and configure. Install the chosen app. Configure premium ($2.49 to $3.99 flat or 1.5 to 2% of cart). Build the cart drawer widget with proper microcopy, trust signals and mobile sizing. Set up the auto-approve matrix and claim form. Connect to Klaviyo for confirmation and resolution emails.
- Week 3: Launch and measure. Push live. Monitor attach rate daily for the first 14 days. A/B test the price point if attach rate is under 30%. Test microcopy if attach rate is between 30 and 45%. Add Extra Cover and Signature on Delivery rules to your shipping app for parcels over $200 and $300 respectively.
- Week 4: Tune and document. Tighten the claim workflow to a true 24-hour resolution. Document the SOP for support so it survives turnover. Add a weekly review to your monthly business cadence: attach rate, claim rate, payout ratio, pool surplus, CSAT on claim resolutions.
By day 30 you have a working insurance product earning 0.8 to 1.5% of top-line revenue, a claim rate trending down from carrier-side defence, and a 4.5+ CSAT score on the worst-day-of-the-customer-relationship moments. That is the playbook the brands holding their margin in 2026 are running.
Three failure modes that kill the system before it gets to month 3
- Pre-checked widgets that backfire. Auto-toggled protection looks like free revenue for the first month, then the chargebacks and ACCC complaints arrive. Always opt-in. Your attach rate will be 10 points lower and your retention will be 10 points higher.
- Slow claim resolution. The 24-hour promise is the product. Take 5 days to resolve and customers will say “I paid you extra for this and you still made me chase” on every review platform you sell on. Build the workflow before you switch the widget on.
- Treating the pool as profit too early. The first 90 days of premium revenue is a float, not profit. You will see claim spikes around peak season, regional weather events, and after viral product moments. Keep the pool aside as a working buffer until you have 6 months of data showing the steady-state ratio.
Your checklist before you switch the widget on
- 90-day bleed table completed. True claim rate and average claim cost documented.
- Self-insured vs third-party decision made. App installed (Navidium, Captain, Route, or Corso).
- Premium model chosen: flat fee, percentage, or dynamic. Price point set at 4 to 8x your claim cost per order.
- Cart drawer widget live with opt-in toggle, benefit-led microcopy, trust signal, mobile-first sizing.
- Self-service claim form built. Auto-approve matrix set. Klaviyo flows connected for confirmation, resolution and CSAT follow-up.
- Resolution promise codified: 24 hours, refund or reship choice, MSRP replacement.
- Extra Cover, Signature on Delivery, and Photo on Delivery rules set in your shipping app for parcels above your threshold.
- Weekly KPI added to the operating dashboard: attach rate, claim rate, payout ratio, pool surplus, CSAT.
- SOP documented so the system survives the next support hire.
Shipping protection is one of the highest-ROI checkout features almost no Aussie founder is running properly. The brands that get this right take a quiet $30,000 to $50,000 line of margin bleed and turn it into a $60,000 to $100,000 margin gain on the same revenue base. The capability is sitting in apps that cost $11 to $99 a month. The only thing in the way is the discipline to design the six layers, ship them in 30 days, and run the workflow every day.
Inside eCommerce Circle, shipping insurance architecture is one of the core Protection pillars we work on with every member. If you want a second opinion on yours, let’s talk.