You opened Meta Ads Manager on Monday and saw a 4.2x ROAS on your prospecting campaign. You felt good. Then you opened your Shopify dashboard and saw revenue had dropped 18% week on week with the same ad spend. Both reports were technically correct. Both pointed to opposite conclusions. So you made the call most Aussie founders are making in 2026: you trusted the platform number, scaled the campaign, and burned another $6,400 of cash flow on traffic that did not turn into orders.
What’s in This Article
This is the trap. Platform ROAS is not lying out of malice. It is just measuring something different from what you actually need to manage your business. After working with hundreds of Aussie Shopify founders, the pattern is consistent: the operators who scaled past $2m without going broke stopped looking at Meta ROAS as their north star sometime in 2024. The ones still glued to channel-level numbers are the ones who keep getting blindsided by P&L surprises every month.
The fix is one metric. Marketing Efficiency Ratio. Total revenue divided by total marketing spend. No attribution windows. No view-through credit. No pixel arguments. Just the two numbers your accountant cares about, in a ratio your team can run a business on. This is the framework Aussie DTC brands are using in 2026 to make weekly budget decisions that actually map to bank balance.
Why Platform ROAS Stopped Working in 2026
Three things broke ROAS as a planning tool, and all three landed in the same eighteen-month window.
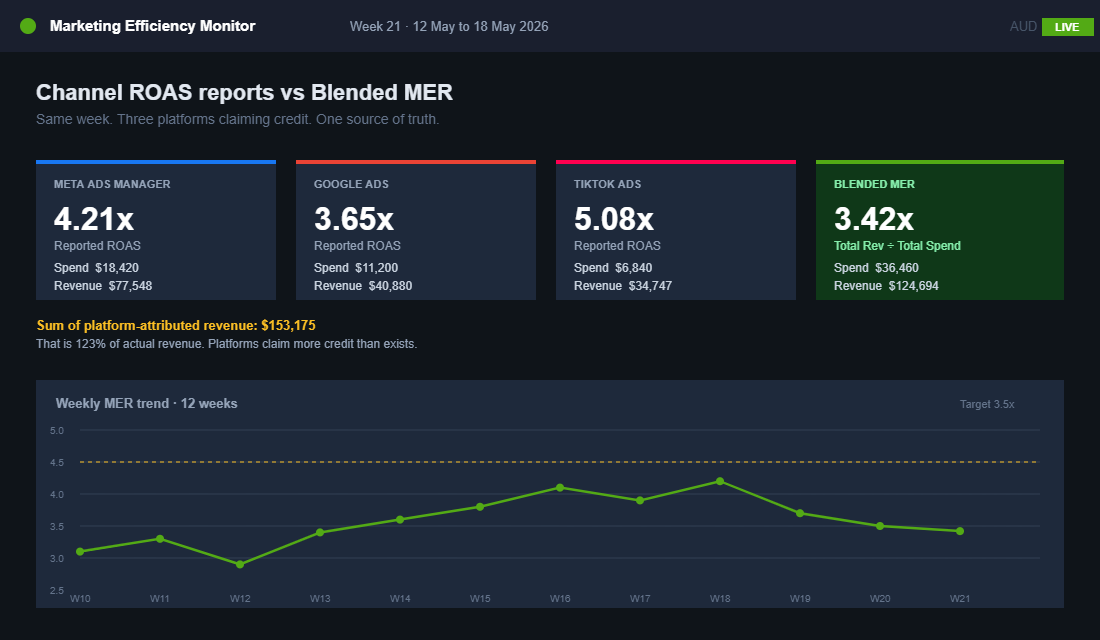
First, attribution drift. Meta is now inflating reported ROAS by around 28% on average. Google sits around 18%. TikTok is the worst at 35% over-attribution. The platforms cannot see what your other channels are doing, so they claim credit for sales they did not generate. If you run Meta, Google, TikTok and email, you can have a stack of platform reports that add up to 130% of your actual revenue. That is not a measurement problem you can solve with smarter UTMs. That is a structural ceiling.
Second, iOS Link Tracking Protection. Apple expanded this in September 2025 to strip click identifiers (including Meta’s fbclid) from URLs opened in Private Browsing mode, Mail, and Messages. For Aussie brands with a lot of mobile traffic and a customer base that lives on iPhones, this stripped out 40 to 60% of the click data Meta’s algorithm was learning on.
Third, Shopify’s January 2026 pixel change. The default conversion mode shifted to “Optimized”, which throttles purchase events sent to Meta in certain checkout scenarios. Brands woke up to Meta purchase events dropping 20 to 40% overnight, with no corresponding drop in actual sales. Reported ROAS tanked. Budgets got cut. Campaigns that were genuinely working got killed because the dashboard said they were not.
That is the environment you are running ads in right now. The platform number is structurally unreliable. Your finance team still needs an answer. MER is the answer.
What MER Actually Is (And Why It Is So Powerful)
MER is simpler than any metric in your dashboard. The formula:
MER = Total Revenue ÷ Total Marketing Spend
Total revenue is the number on your Shopify home screen. Total marketing spend is every dollar that left your account to acquire or retain customers this period: Meta, Google, TikTok, Pinterest, agency retainers, influencer fees, email platform subscriptions, affiliate payouts, the lot. Add them up. Divide.
If you did $250,000 in revenue last month on $50,000 of marketing spend, your MER is 5.0. If you did $180,000 on $60,000, your MER is 3.0. There is no version of this calculation that a junior team member can mess up. There is no version where Meta and Google disagree about who gets credit. There is no attribution window. There is only the two numbers, in the same period, on the same line of your bank statement.
The power of MER is not the maths. The power is what it does to decision-making. When MER is your weekly headline number, your team stops fighting about which campaign deserves credit. They start asking the only useful question: did the business generate enough revenue this week for the total marketing investment we put in? That is the question your bank account is asking too.
The Real MER Numbers Aussie Brands Are Hitting in 2026
Here is where most operators get stuck. They hear “target a 4x MER” online and assume that applies to them. It does not. MER targets shift dramatically with revenue stage and category, because the mix of paid and owned channel revenue shifts as you scale. Use these as your starting brackets, then refine for your margin structure.
- Under $50k AUD/month: Target MER 2.5x to 3.0x. You are still buying brand awareness and have minimal email or repeat revenue. Most spend goes to prospecting. Anything above 3.0 here is excellent.
- $50k to $200k/month: Target MER 3.0x to 3.5x. You are starting to see email and SMS flows kick in. The owned channels do 15 to 25% of revenue. Paid still carries the load.
- $200k to $500k/month: Target MER 3.5x to 4.5x. Email and retention compound. Repeat customers should be 25 to 35% of revenue. Paid efficiency improves because the brand is doing the warming.
- $500k to $2m/month: Target MER 4.0x to 5.0x. You have the brand, the email database, the influencer network, and the organic search to lean on. Paid becomes a top-of-funnel accelerator more than a primary driver.
- $2m+/month: Target MER 4.5x to 6.0x. At this scale, owned channels carry the majority of revenue. Paid should be highly efficient or the business is leaking margin.
Two category modifiers matter. Beauty and supplements brands can run lower MER (2.5 to 3.5) because the repeat-purchase economics are so strong. The first order is the down payment on the LTV. Apparel and accessories brands often need MER 4.0+ because gross margins after returns and discounting are thinner than the founder thinks they are. If your contribution margin is below 30%, you need a higher MER to make the unit economics work.
How to Calculate Your Break-Even MER (The Number That Stops the Bleeding)
Before you set a target MER, you need to know your break-even MER. This is the line below which every additional dollar of spend is destroying cash. Most founders have never calculated this. They are flying with no floor.
The formula:
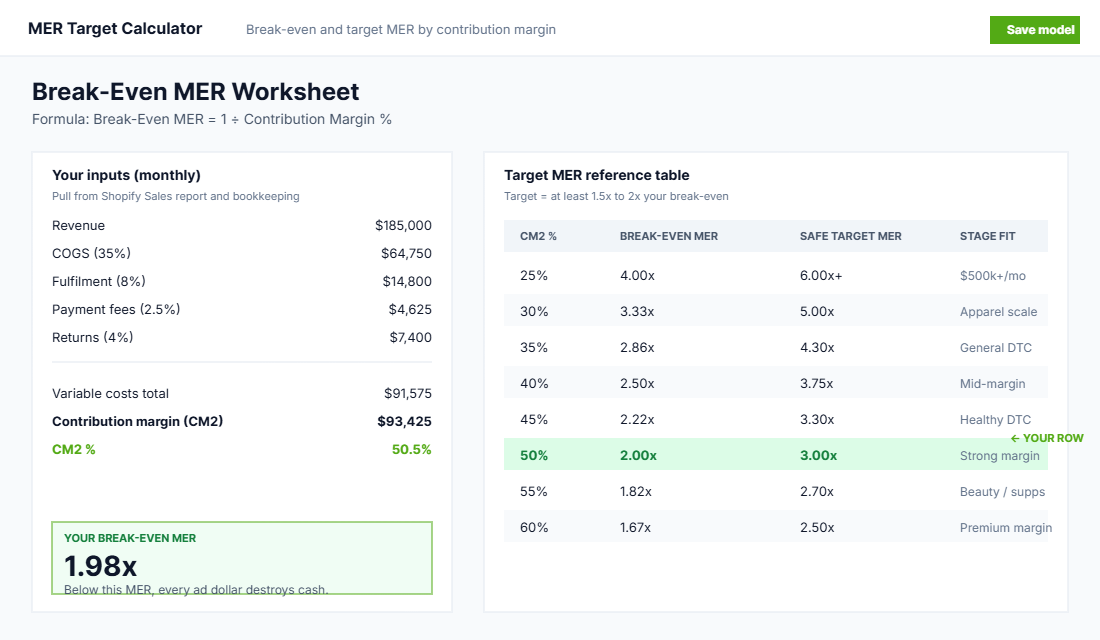
Break-Even MER = 1 ÷ Contribution Margin %
Contribution margin here is contribution margin 2 (CM2): revenue, less COGS, less fulfilment, less payment processing, less returns. It is what is left to pay for marketing, fixed costs, and your salary. If your CM2 is 40%, your break-even MER is 1 ÷ 0.40 = 2.5x. If your CM2 is 50%, break-even MER is 2.0x. If CM2 is 30%, break-even MER is 3.33x.
That number is the floor, not the target. Hitting break-even MER means you covered marketing and paid for the product. You did not pay rent, your team, your tech stack, your tax, or yourself. To actually run a healthy business, you need MER comfortably above break-even, with enough headroom to cover your fixed cost base and leave a profit. As a rule of thumb, target MER should be at least 1.5x to 2x your break-even MER.
If you have not run the contribution margin numbers properly, this is the work to do first. The contribution margin audit playbook walks through every line you need to capture before setting an MER target.
The Weekly MER Tracking System Every Aussie Founder Should Run
MER is only useful if it is measured weekly. Monthly is too late. Daily is too noisy. Weekly gives you four data points a month, enough to spot a trend before it costs you tens of thousands, and small enough that you actually do it.
Here is the weekly cadence that works. Pick Monday morning. Spend twenty minutes. Capture six numbers:
- Total Shopify revenue for the previous Monday to Sunday window. Pull from Shopify Analytics, Sales over time report.
- Meta spend. Pull from Ads Manager, custom date range, exclude GST if you want apples-to-apples with net revenue.
- Google spend. Pull from Google Ads, all campaigns, same window.
- Other paid spend. TikTok, Pinterest, affiliate, influencer payouts, agency fees, email platform subscriptions for the period. Pro-rated where needed.
- Total marketing spend. Sum of the above.
- MER. Revenue divided by total marketing spend. Two decimal places.
Log these in a single spreadsheet. One row per week. After eight weeks you have a baseline. After twelve weeks you have a trend that beats any platform dashboard. The Aussie brands hitting the right MER consistently are the ones who treat this as a non-negotiable Monday ritual, not a quarterly exercise.
The most important column is not the MER itself. It is the week-on-week delta. A 0.3x drop in MER, sustained for two weeks, is a signal that something has changed. It might be ad creative fatigue. It might be a seasonal dip you did not budget for. It might be a tracking issue that is making one platform look better than it is. The point is you see it on week three, not when the month-end report lands.
When MER Lies: Four Pitfalls That Catch Out Aussie Founders
MER is the most honest blended metric you can run. It is not perfect. Four situations distort it, and you need to know what they look like so you do not over-react.
- 1. Founder-led PR spikes. You went on a podcast, got featured in The Australian, or had a viral TikTok. Revenue lifts but you did not spend more on ads. MER spikes. This is a real result but it is not repeatable. Annotate the week and discount it when looking at the trend.
- 2. Big email or SMS campaigns. A welcome offer launch or a Black Friday email blast can do $40,000 of revenue on a $300 platform fee. MER for the week looks incredible. Again, real but not a sustainable benchmark. Smooth it across the month.
- 3. Deferred LTV. If you are running a subscription brand or have a long product replenishment cycle, the revenue from this month’s acquisition shows up over the next six months, not this week. Low MER this week does not mean unprofitable acquisition. It means you need to look at MER over a longer window, or pair it with CAC payback period.
- 4. Inventory stockouts. Revenue falls because you ran out of your hero SKU, but you kept the ads on. MER tanks even though your ad efficiency was fine. The fix here is operational, not marketing. Look at sell-through, not MER, when this happens.
The rule: MER is your single best weekly metric, but it is not the only metric. Pair it with new-customer MER (revenue from first-time buyers ÷ total marketing spend) once a month. If your blended MER is healthy but your new-customer MER is collapsing, you are running on existing customer revenue and your acquisition engine has stalled. That is the diagnosis only the blended view can give you.
The Tool Stack: Free Spreadsheet, Triple Whale, or Northbeam
You do not need a $1,500/month attribution tool to track MER. You need a Google Sheet. The decision tree:
- Under $100k/month: Spreadsheet. Six columns, twenty minutes a week. Use the template below. No tool is going to give you better insight than your own discipline at this stage.
- $100k to $1m/month: Triple Whale or Polar Analytics. Triple Whale plans start around $129/month for smaller stores and scale with revenue. The value is the time you save and the daily push notifications when MER drops below your target. Polar Analytics is a strong alternative with a similar feature set.
- $1m+/month: Triple Whale Compass or Northbeam. Northbeam starts at $1,500/month and is built for brands serious about media mix modelling and incrementality testing. Worth it when paid spend is over $200k/month and you need to defend the marketing budget to a board or finance team.
The trap to avoid: buying an attribution tool before you have the discipline to use one. Most brands sign up for Triple Whale, log in twice in the first week, then leave it running in the background. The tool only works if it is the Monday ritual. If you are not already tracking MER in a spreadsheet, do not pay $129/month for a tool to track it for you. Build the habit first.
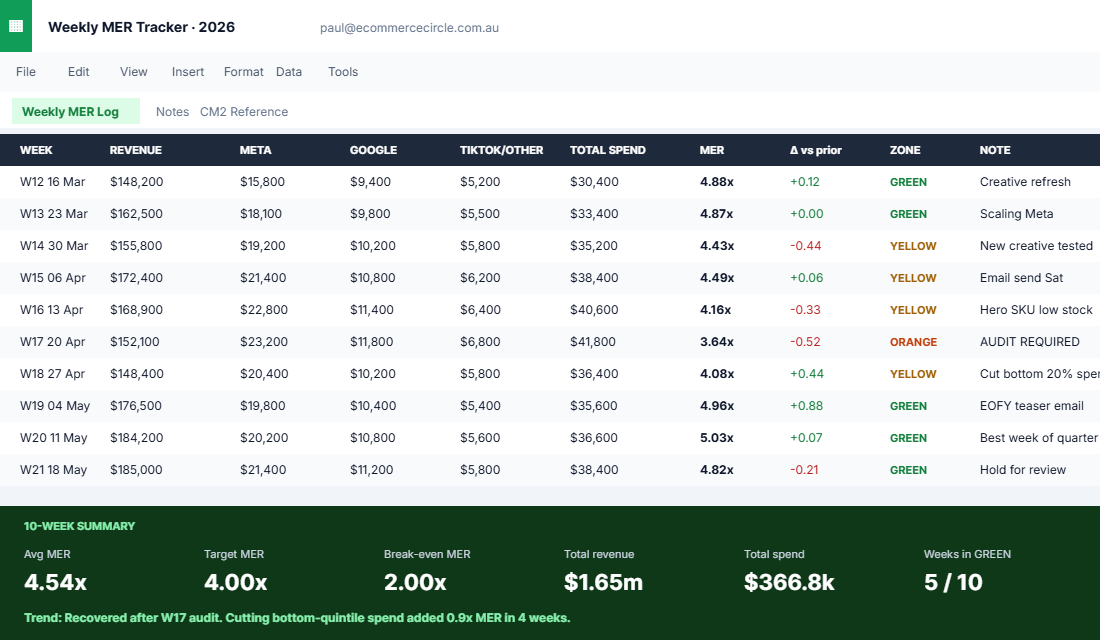
The MER Decision Framework: What to Do When the Number Moves
Tracking MER is only useful if it changes what you do. Here is the four-zone framework that the best operators in our member base use to make weekly decisions.
- Green zone (MER above target): Scale. Add 10 to 20% to the budget on the campaigns or channels you can identify as the lift. Do not double overnight. Compound the wins. If MER stays in green for two weeks, push harder.
- Yellow zone (MER at target, within 0.3x): Hold. Do not touch the budget. Run the creative refresh. Test one new audience or angle. Keep the ship steady.
- Orange zone (MER below target by 0.3 to 0.7x): Audit. Pull the campaign-level reports and find the weakest performer. Pause the bottom 20% of spend. Test new creative. Check Shopify checkout for any friction that landed in the period.
- Red zone (MER below break-even): Stop. Pause all paid acquisition for 48 hours. Diagnose what changed. This is not a creative problem. This is a unit economics problem or a tracking failure. Find it before you spend another dollar.
This framework removes the emotional whiplash that kills most ad accounts. When you have a rule for when to scale and a rule for when to stop, you stop reactively cutting good campaigns and stop reactively scaling lucky ones. The decisions become boring. Boring is what scales.
Pairing MER With Contribution Margin: The True North
MER on its own is incomplete. You can hit a 4x MER and still go broke if your contribution margin is too thin or your fixed cost base is too heavy. The brands that scale profitably pair MER with a second number: contribution margin after marketing (CM3).
CM3 = revenue, less COGS, less fulfilment, less payment processing, less returns, less marketing spend. As a percentage of revenue, healthy DTC sits at 20 to 25% CM3. Below 10% signals a structural problem: wrong pricing, unsustainable CAC, or a channel mix that is bleeding you. Above 30% means you are ready to scale aggressively.
Track both, weekly. MER tells you how efficiently you are converting marketing dollars into revenue. CM3 tells you whether that efficiency is producing actual profit after all variable costs. They are the two numbers that make every other dashboard optional. If you only had these two, you could still run a Shopify business.
This is also where MER plugs into the broader profit work covered in the CAC payback period framework and the 8-week rolling cash flow forecast. MER is the input. CM3 and cash flow are the outputs. The point of measuring MER is so you can manage what comes after it.
The MER Weekly Checklist: Your Monday Morning Ritual
Copy this into a Notion page or print it. Twenty minutes every Monday. No exceptions.
- Pull last week’s total Shopify revenue (Mon to Sun)
- Pull Meta ad spend for the same window
- Pull Google ad spend for the same window
- Pull TikTok / Pinterest / affiliate / influencer spend for the window
- Pro-rate any monthly retainer fees (agency, email platform) into the weekly figure
- Sum total marketing spend
- Calculate MER = Revenue ÷ Total spend (two decimal places)
- Log in the tracker spreadsheet with the date
- Compare to last week and the four-week rolling average
- Identify the zone (green, yellow, orange, red) against your target MER
- Note one operational reason for any movement (creative refresh, sale, stockout, PR)
- Decide the action for this week based on the zone
That is it. Twelve steps, twenty minutes, and you are running a more disciplined marketing operation than 90% of Aussie Shopify brands at your revenue stage. The compound effect of doing this every Monday for twelve months is what separates the brands that scale from the brands that stall.
Seasonality: Why a Single MER Target Breaks Four Times a Year
Most founders set one MER target in January and defend it until December. That is why the number feels wrong for about five months of the year. Demand, competition for ad inventory, and discount depth all move on an Australian calendar, and your efficiency ratio moves with them.
Run four targets, not one. Here is the pattern that shows up across Aussie stores turning over $80k to $500k a month.
- Q1 (Jan to Mar), the post-Christmas lull. Meta CPMs in Australia typically fall 20 to 30% from their November peak, but so does buying intent. Expect MER to sit near your annual average and use the cheap inventory to test creative rather than chase volume.
- Q2 (Apr to Jun), the EOFY run. Business-adjacent and higher-ticket products get a genuine lift into 30 June. A 0.3 to 0.5 point improvement on MER is realistic if your offer suits the tax-deduction story.
- Q3 (Jul to Sep), the quiet quarter. Set your softest MER target of the year here and protect cash. This is the quarter where founders panic and cut spend the day before the Q4 build.
- Q4 (Oct to Dec), BFCM. Australian CPMs routinely run 40 to 70% above the yearly average through the last two weeks of November. Blended MER often improves because conversion rates spike, while contribution margin per order falls because of discounting. Both are true at once, and only one of them pays the rent.
The trap in Q4 is reading a strong MER as a strong quarter. If you discount 25% and your gross margin was 65%, your effective margin drops to roughly 53%, which moves your break-even MER from about 1.54 to about 1.89. A 2.1 MER in November is a thinner result than a 2.1 in August, not a better one.
Build the four targets into the same sheet you already track weekly. One column for the quarter, one for the blended margin you expect in it, one for the break-even MER that margin implies, and one for the target you actually want to hit. Triple Whale and Northbeam both support custom date comparisons, so compare this November to last November, never to last month.
One more rule. The day you change your discount structure, recalculate break-even MER. Founders update the promo and forget the maths, then spend six weeks wondering why revenue grew and the bank balance did not. The same discipline applies to the numbers flowing into your books, which is why the Shopify and Xero reconciliation system is worth running alongside this one.
The Compound Effect: Why MER Discipline Wins Over Time
Here is what twelve months of weekly MER tracking does to a business. You stop chasing platform ROAS like it is a leaderboard. You stop killing campaigns based on tracking artefacts. You start having conversations with your media buyer or agency that are grounded in business outcomes, not vanity numbers. Your finance team finally has a marketing metric they can model against revenue.
The Aussie founders who run this discipline weekly for a year see two specific outcomes. First, they pull back on the channels that were flattering their reports but not moving the business. Usually one or two campaigns. Often it is the brand-led Google Search campaign that was claiming credit for traffic that was coming anyway. Second, they discover at least one channel they were under-spending on. Almost always email or SMS, because those channels were never inflating the dashboard but were quietly carrying the MER.
The first realisation saves money. The second realisation makes money. Both come from the same Monday morning twenty minutes. That is the whole game.
Inside eCommerce Circle, building this Monday morning rhythm is one of the first things we work on with new members, because everything else (creative testing, audience expansion, retention programs, even pricing changes) becomes measurable once MER is in place. Without it, you are guessing. With it, you are running a business. If you want a second opinion on your current MER, your target, or whether your contribution margin can support the spend you are running, let’s talk.