Most Shopify founders end the month exhausted. They spent the last 30 days putting out fires. Ad budget overspent on a Wednesday. A supplier went silent for a week. A customer complaint blew up in the inbox. And when the calendar flips to the 1st, they cannot answer the only question that matters. What actually happened this month, and what should we do differently next month?
What’s in This Article
This is the gap between an operator and a CEO. An operator reacts to the last fire. A CEO runs a monthly business review (MBR) on a fixed cadence, with a one-page dashboard, and walks out with three or four actions that compound. The difference shows up in 12 months. The operator is still busy. The CEO has a brand worth two or three times more.
McKinsey research shows companies making structured data-driven decisions are 23 times more likely to acquire customers, six times more likely to retain them, and 19 times more likely to be profitable. The MBR is the operating ritual that turns a Shopify store into one of those companies. Inside eCommerce Circle we run this exact playbook with every founder. Here is what it looks like.
Why the MBR Is the Most Underused Founder Ritual
Most Aussie Shopify founders run their store on three rituals. A daily check of the Shopify app on the phone. A weekly meeting with the marketing person. A panic at month end when the accountant asks for receipts. None of those rituals answer the question of whether the business is actually getting better.
The MBR is the missing layer. It sits between the weekly operating rhythm and the 90-day quarterly sprint. The weekly meeting is for clearing blockers. The quarterly sprint is for resetting strategy. The MBR is for spotting trends, comparing to plan, and deciding what gets your attention for the next 30 days.
Done well, the MBR takes 60 minutes a month and ends with three to five action items. Done badly, it becomes a 90-slide deck nobody reads. The whole skill is keeping the document to one page, the meeting to one hour, and the actions to a single MIT (most important task) list. We will get to all three.
The 12-KPI One-Page Dashboard
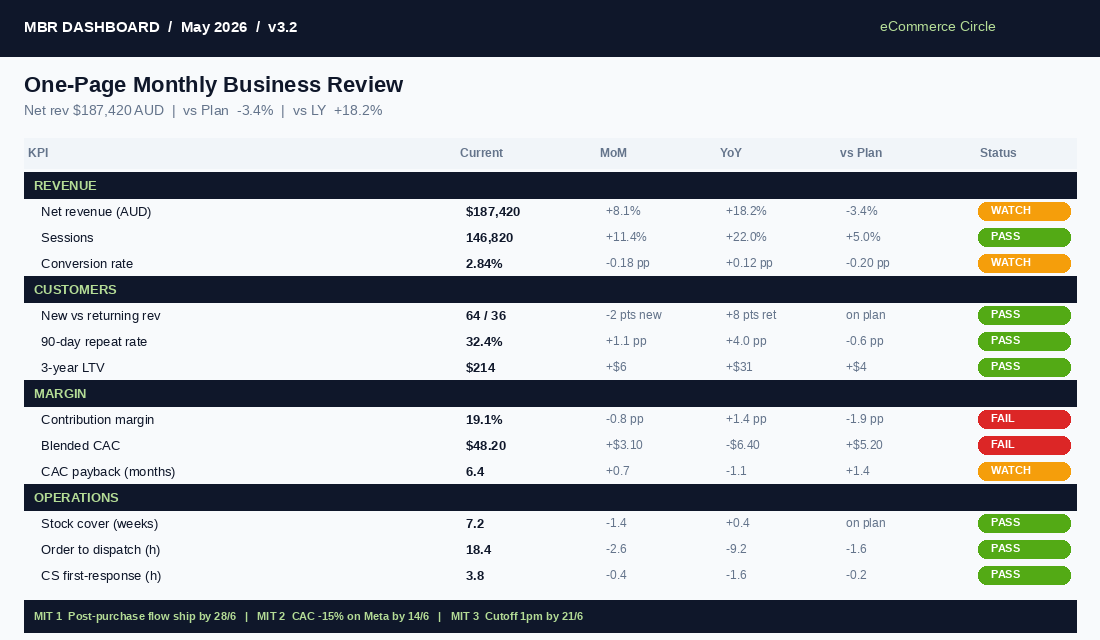
The CEO dashboard rule of thumb is 12 to 20 KPIs across four categories. For a Shopify store between $40k and $500k per month, twelve is the sweet spot. Any more and you stop reading them. Any fewer and you miss the leading indicators that matter. Here is the layout we recommend.
Revenue (3 KPIs)
- Net revenue. Gross revenue minus discounts, refunds and returns. This is the only revenue number that should ever appear in your dashboard. Top-line gross flatters bad months.
- Sessions. The traffic engine. A growing revenue number on flat sessions is conversion lift. A growing revenue number on growing sessions is acquisition lift. They are different problems with different fixes.
- Conversion rate. Net orders divided by sessions. Industry average for Shopify sits around 2.5 to 3.0%. If you are below 2%, the bottleneck is on-site. If you are above 3.5%, the bottleneck is traffic volume.
Customers (3 KPIs)
- New vs returning revenue split. Most founders cannot quote this number. Healthy DTC sits at 50/50 by month 18. If you are at 80/20, you are renting customers from Meta, not building a brand.
- Repeat purchase rate (90-day). Of customers who bought 90 days ago, what percentage have bought again? Average Shopify stores land at 28 to 35%. Top performers hit 40 to 60%.
- Customer lifetime value (3-year). Average Shopify LTV is $168 over three years. Top operators reach $250 to $450. Subscription stores hit $350 to $800. If you do not know yours, you are guessing on every CAC decision.
Margin (3 KPIs)
- Contribution margin %. Revenue minus COGS, payment fees, shipping subsidy, returns and CAC. This is the number that pays your salary and funds growth. See the contribution margin audit for the full breakdown.
- Blended CAC. Total marketing spend divided by total new customers. Not channel-reported CAC. Blended is the only one that survives iOS 14 attribution loss.
- CAC payback period. Months until contribution margin from a new customer covers their acquisition cost. Healthy DTC sits at 4 to 8 months. Anything over 12 months and you are running on borrowed time.
Operations (3 KPIs)
- Stock cover (weeks). Weeks of forward stock at current sell-through. Anything below 4 weeks for your hero SKU is a stockout risk. Anything above 16 weeks is cash trapped on shelves.
- Order to dispatch time (hours). Median hours from order placed to AusPost or StarTrack scan. Aussie customers expect under 24 hours. Above 48 hours and your reviews start sliding.
- Customer service first-response time (hours). Median hours to first reply on tickets. Under 4 hours is competitive. Over 24 hours and you start churning customers before they have even received the product.
That is your one-page dashboard. Twelve KPIs. Four categories. Print it on A4 the first business day of the month. If it does not fit on a single page, you are tracking the wrong things.
The Three Comparison Lenses
A KPI on its own is meaningless. $180k revenue could be a record month or a disaster. Context is everything. Every number on the MBR dashboard sits next to three comparison columns.
- Month-over-month (MoM). This month vs last month. Catches trend reversals fast. Useful in the first six months of MBR practice when patterns are short.
- Year-over-year (YoY). This month vs the same month last year. Strips out seasonality. May 2026 vs May 2025 is a real signal. May 2026 vs April 2026 includes the EOFY effect and tax-refund spend skew.
- Versus plan. This month vs the budget or OKR target you set at the start of the quarter. The most important column. A 12% MoM lift means nothing if your plan was 25%.
Most founders skip the third column because they never set a plan. That is the actual problem. The MBR forces you to set a number at the start of the quarter and then look it in the face every 30 days. It is uncomfortable, which is exactly why it works.
The 60-Minute MBR Agenda
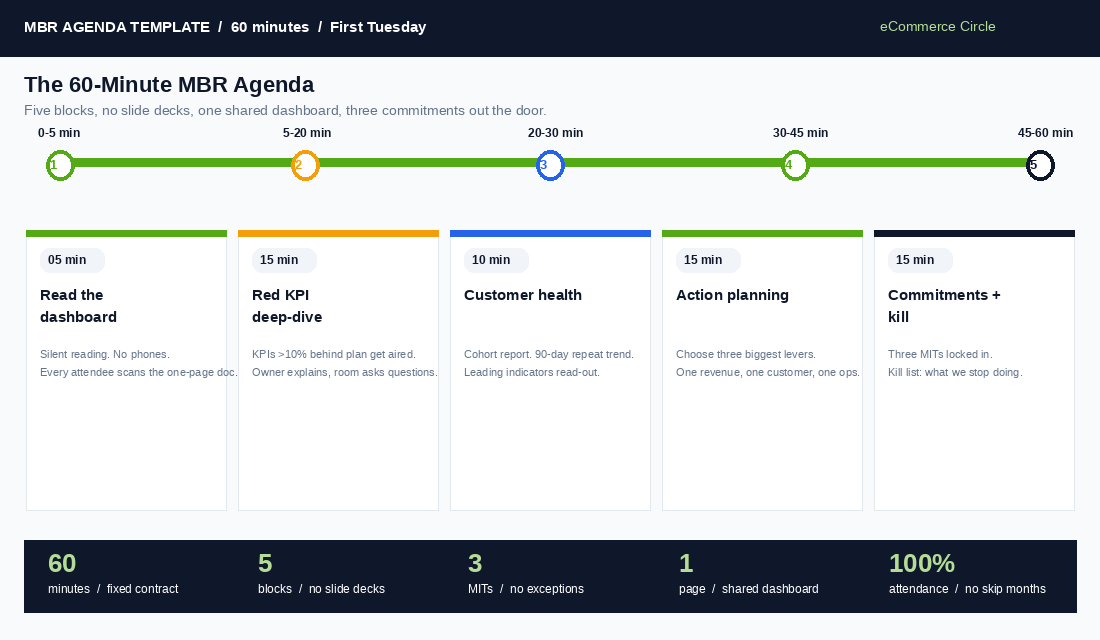
The Amazon MBR template runs to six pages or fewer and meets 5 to 10 business days after month end. For a Shopify store between $40k and $500k a month, you can run a tighter version. Sixty minutes. Five blocks. No presentation. Just the one-page dashboard and a notebook.
- 0 to 5 minutes. Read the dashboard. Everyone in the room reads the one page in silence. Founder, marketing lead, ops lead, and whoever owns customer service. No talking. Five minutes of quiet reading. This is the most important block. Most meetings fail because half the room has not read the doc.
- 5 to 20 minutes. Red KPI deep-dive. Any KPI flagged red (worse than plan by more than 10%) gets discussed first. Owner of the KPI explains what happened. Group asks questions. No solutioning yet, just understanding.
- 20 to 30 minutes. Customer health check. Pull up the cohort report. Look at the 90-day repeat rate trend over the last six months. Is it improving, flat, or sliding? See the cohort analysis playbook for the full setup.
- 30 to 45 minutes. Action planning. Pick the three biggest levers for the next 30 days. Not ten. Not five. Three. One per category usually works (one revenue, one customer, one ops). Each action has an owner, a metric it will move, and a 30-day review date.
- 45 to 60 minutes. Commitments and kill list. What are we stopping? What are we starting? What is the kill list of projects that are not contributing? This block matters because most stores have too many in-flight projects, not too few.
Run it on the first Tuesday of every month. Same time. Same room. Same one-page dashboard. The ritual matters as much as the content. Founders who skip MBRs in busy months are the same founders who wonder why the business plateaued.
The MIT Action Discipline (Three Tasks, Not Ten)
The single biggest failure mode in monthly reviews is leaving the room with 14 action items. Nothing on a 14-item list gets done. We force a hard cap of three Most Important Tasks (MITs) coming out of every MBR. That is it.
Each MIT has four fields and nothing more. Owner. Metric it moves. Specific commitment. Review date. Written on the bottom third of the one-page dashboard. Pinned to the wall. Sent to Slack. Visible everywhere.
- MIT 1 example. Owner: Paul. Metric: 90-day repeat rate. Commitment: Launch the post-purchase email flow (5 emails, days 3, 7, 14, 30, 60). Review date: 28 June.
- MIT 2 example. Owner: Sarah (marketing lead). Metric: Blended CAC. Commitment: Pause 4 underperforming Meta ad sets, redirect $8k AUD to top 3 winners. Review date: 14 June.
- MIT 3 example. Owner: Tom (ops). Metric: Order to dispatch time. Commitment: Move 3pm cutoff for same-day to 1pm, hire a Saturday picker for 4 weeks. Review date: 21 June.
Three tasks. Three owners. Three review dates. The next MBR opens with the three commitments from last MBR and a green or red tick next to each. Public accountability is the engine. The discipline of writing “did not ship” next to your own name in front of your team is what changes behaviour over time.
Connecting the MBR to Your Quarterly OKRs
The MBR does not replace your quarterly plan. It feeds it. The four-tier operating cadence used by serious operating businesses runs Weekly Operating Review, Monthly Business Review, Quarterly Review, and Annual Planning. Each tier feeds the one above. Without the monthly layer, the quarterly review becomes guesswork.
Here is how we structure the cascade for a Shopify founder doing $1m to $5m AUD a year. At the start of each quarter, you set three OKR targets. They live at the top of the MBR dashboard as the “versus plan” column anchors. Every monthly review measures progress against those quarterly targets.
- Q3 OKR example 1. Lift 90-day repeat rate from 28% to 35%. MBR feeds: monthly cohort report, post-purchase email performance, loyalty program enrolments.
- Q3 OKR example 2. Cut blended CAC by 15%. MBR feeds: ad spend efficiency, channel mix, organic vs paid revenue split.
- Q3 OKR example 3. Add $40k AUD to contribution margin. MBR feeds: COGS audit, shipping subsidy, return rate, payment fee renegotiation.
At the end of the quarter, the MBR pattern across three months tells you whether you hit the OKR. If May tracked behind, June pulled forward, and July hit plan, the quarterly review is a celebration. If three months in a row went red on the same KPI, the quarterly review is a strategy reset. Either way, you walk into the quarterly meeting knowing the answer before it starts. That is the entire point.
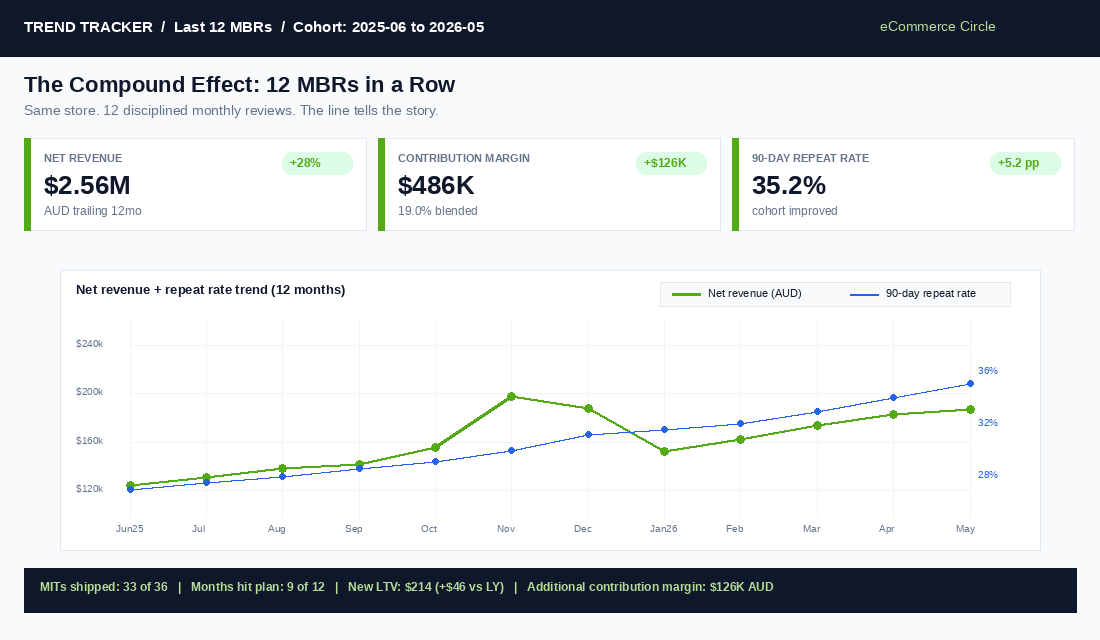
The Compound Effect: 12 MBRs in a Row
The magic of the MBR is not in any single review. It is in 12 of them in a row. A founder who runs MBRs religiously will look back at month 12 and see compounding patterns that would have been invisible without the ritual.
Take the math. A Shopify store doing $2m AUD a year with a 30% 90-day repeat rate and a contribution margin of 18%. Lift repeat rate by 5 percentage points (to 35%) through one consistent MIT a month focused on retention. That single lever, according to the Loop Returns 2026 benchmark data, increases LTV by 25 to 30%.
- Year 1 baseline. $2m revenue, 18% contribution margin, $360k margin. 30% 90-day repeat rate. LTV $168.
- Year 1 with MBR discipline. 12 MITs focused on the right levers. Repeat rate climbs to 35%. LTV climbs to ~$215. Same traffic and CAC produces 28% more lifetime revenue.
- Compound effect. $560k additional revenue, $100k+ additional contribution margin, all from running a one-hour meeting once a month.
This is not a hypothetical. We see this pattern across every founder we coach inside eCommerce Circle. The brands that institute the MBR ritual in their first 12 months grow at a different rate. Not because the dashboard is magical. Because the discipline of forcing yourself to look at the numbers, set commitments, and report back creates accountability that nothing else does.
Tools and Templates: What You Actually Need
You do not need a $300 a month dashboard tool to start. You need a Google Sheet, an hour to set it up, and the discipline to run the meeting. Here is the starter stack we recommend for a Shopify store under $5m AUD.
- The dashboard. Google Sheets, one tab per month, 12 rows for the 12 KPIs, 4 columns for current month plus three comparison lenses. Free. Takes two hours to set up the first time.
- The data sources. Shopify analytics for revenue, sessions, CR, AOV. Klaviyo for repeat rate and email-attributed revenue. Lifetimely or TrueProfit ($79 to $199 AUD per month) for contribution margin and CAC payback if you want to avoid spreadsheet errors.
- The meeting doc. Notion or a shared Google Doc. One page per month. Locked template. The dashboard at the top, the agenda below, the three MITs at the bottom.
- The trend tracker. A second Google Sheet tab plotting each KPI across the last 12 months as a line chart. This is the chart you will refer to in the quarterly review.
If you are above $5m AUD a year, upgrade to a proper analytics layer (Triple Whale, Polar Analytics, or a custom Looker Studio dashboard pulling from your warehouse). But do not let tool selection delay the start. The Google Sheet works fine for the first six months. The discipline is what matters.
The 30-Day Rollout Plan
Here is how to go from “I have heard of MBRs” to “we run them every month” in 30 days. Do not try to perfect the dashboard before starting. The first three MBRs will be rough. That is fine. The discipline of running them is what compounds, not the polish.
- Days 1 to 3. Build the dashboard skeleton. Open a Google Sheet. Add the 12 KPIs. Add the four columns (Current, MoM, YoY, vs Plan). Pull last month’s numbers manually. Do not automate yet.
- Days 4 to 7. Set the quarterly plan numbers. Pick three OKR targets for the current quarter. Write them at the top of the dashboard. These become your “vs Plan” anchors.
- Days 8 to 14. Run MBR #1. Block the first Tuesday after month-end. 60 minutes. The team reads the dashboard. You walk out with three MITs. Send the MITs to Slack the same afternoon.
- Days 15 to 30. Execute the MITs. Owners ship their commitments. You check in twice (mid-month and three days before next MBR). The MIT update goes to the top of next month’s MBR agenda.
- Day 30. Run MBR #2. Open with the three MITs from MBR #1. Green or red. No excuses. Set the next three MITs. Repeat.
Do this for six months and the MBR becomes the single most valuable meeting on your calendar. Done well, it is the difference between a Shopify store that does $1.5m AUD a year for three years in a row and one that compounds to $3m, then $5m, then a real exit.
The Common Failure Modes (And How to Avoid Them)
Most founders who try MBRs quit within three months. The reasons are predictable. Knowing the failure modes lets you steer around them.
- The dashboard creep. Twelve KPIs becomes 18, then 30, then a 40-tab spreadsheet nobody opens. Cap it at 12. Print it on A4. If it does not fit, cut.
- The 90-minute meeting. Sixty minutes is the contract. The moment it stretches to 90 minutes, people stop showing up. End on time even if you are mid-sentence.
- The action item flood. Three MITs only. Ten action items means none get done. Force the team to pick the three biggest levers and kill the rest.
- The skipped month. “We were too busy this month.” That is the exact month you needed the review. Never skip. Reschedule, but never skip.
- The solo MBR. Running it alone in your head does not count. The accountability comes from saying the numbers and the commitments out loud in front of other humans. Invite at least one other person.
The other failure mode is starting with too much ambition. Do not try to launch the MBR alongside a website redesign, a new product launch and a hiring sprint. Pick a quiet month. Run MBR #1 with rough data. Polish over the next six months. The version of the dashboard you have in month 12 will look nothing like the one you started with, and that is the whole point.
Your First MBR: A Worked Example
Theory is easy to nod along to, so here is what a first MBR actually looks like. Imagine you run an Aussie skincare brand doing $85K a month. You sit down with your one-page dashboard and three numbers jump out: revenue is up 6% on last month, but contribution margin is down from 31% to 26%, and returning customer rate has slipped from 28% to 22%.
Without the MBR, that month feels like a win. Revenue went up. With the dashboard in front of you, the real story is obvious: you bought the growth. Meta CPMs rose, you leaned on a 20% sitewide discount, and the new customers it brought in were lower quality. The margin dollars actually went backwards by roughly $2,800.
So your three MITs for the month write themselves. One: cap the discount at 15% and test a free-shipping-over-$79 threshold instead, since shipping thresholds typically protect 3 to 5 points of margin versus sitewide percentage discounts. Two: rebuild the post-purchase flow so second-purchase rate recovers, with a target of getting returning customer rate back above 26% within 60 days. Three: ask your 3PL for volume pricing now that you are shipping over 1,100 orders a month.
That is the whole magic of the ritual. Sixty minutes, three decisions, each one tied to a number you will check again next month. Founders who run this loop consistently stop making gut-feel calls in March that they quietly reverse in May.
The Operator Becomes the CEO
Six months into a serious MBR practice, something quiet happens. The founder stops asking “what did we do last month?” and starts asking “what should we do next quarter?” The dashboard answers the first question on autopilot. That frees the founder to spend cognitive load on the bigger decisions. Strategy. Hiring. Brand. The decisions that compound.
This is the real upgrade. The store does not get bigger because the MBR is magical. It gets bigger because the founder gets bigger. The MBR is the scaffolding. Twelve months of standing on it lifts your line of sight from this week’s ad spend to next year’s exit multiple. That is what running a business actually looks like.
Inside eCommerce Circle, the MBR is one of the first rituals we install with every member. Most founders are surprised at how quickly the meeting goes from awkward to indispensable. If you want a second set of eyes on your dashboard and your quarterly plan, let’s talk.