Every problem your store has ever had got solved the same way: you installed an app. The reviews widget was clunky, so you added another. You wanted a popup, a currency switcher, a “someone in Sydney just bought this” badge, a back-in-stock alert. Each one felt like a $19 or $29 decision. Individually, invisible. Together, they have quietly become a second business expense you never actually sat down and approved.
What’s in This Article
Here is the part most founders miss. The average Shopify store runs around six detectable apps, the median store runs four, and plenty of ambitious DTC stores are carrying 20 to 30. The sticker price is not the real cost. The real cost is the drag. Each front-end app can shave 3 to 8 mobile speed points off your store, and Google and Deloitte’s “Milliseconds Make Millions” study found that a 0.1 second improvement in load time lifted retail conversion by 8.4% and average order value by 9.2%. Your app drawer is charging you twice: once on the invoice, once at the checkout.
Most founders “audit” their apps by glancing at the Shopify bill once a year, wincing, and moving on. This playbook is the opposite. It is a five-stage audit you can run in a single afternoon that cuts your monthly spend, recovers real load time, and leaves you with a lean stack you actually control. Let’s pull the drawer open.
Why Your App Drawer Costs You Twice
Start with the money, because it is the easiest to ignore. The average cost of a single Shopify app sits around $58.49 a month, and app pricing has been climbing roughly 15% year on year. Stack six to eight paid apps and most stores are spending $200 to $500 a month before they have sold a single thing. Around 68% of merchants report “app fatigue” from cost that crept up without anyone deciding it should. One documented audit cut a store’s app spend from $281 a month down to $15, which is $3,192 back in the business every year.
Now the tax you cannot see on any invoice: speed. Amazon’s own research found that every 100 milliseconds of added latency cost them roughly 1% in sales. On Shopify specifically, stores that load in under two seconds tend to convert around 2.4%, against the platform average closer to 1.4%. When you are doing $80k a month, that gap is not a rounding error. It is the difference between a good month and a flat one.
The apps doing the most damage are almost always the ones bolted onto the front end: session recorders, live chat, upsell widgets, social-proof popups and review carousels. They run JavaScript on every page load, add network requests, and expand the work the shopper’s phone has to do before anything is clickable. If you want the deeper mechanics on how load time maps to revenue, our Shopify Site Speed Playbook breaks down the technical levers. This playbook is about the upstream decision: which apps earn their place at all.
Stage 1: Pull the Full List (Every App, Every Dollar)
You cannot audit what you cannot see, and Shopify does not show you the full picture in one place. Go to Settings, then Apps and sales channels, and list every single app installed. Then cross-reference your last Shopify invoice, because some app charges bill through Shopify and some bill you directly through their own systems. The apps charging your card off-platform are exactly the ones that escape the annual wince.
Build a simple five-column sheet. One row per app: the app name, its category, its true monthly cost in AUD, its rough front-end speed cost, and a verdict column you will fill in at Stage 2. Do not skip the boring utilities. A $12 currency bar and a $19 restock alert feel harmless individually, but they are often the least-used and heaviest-loading apps in the whole stack.
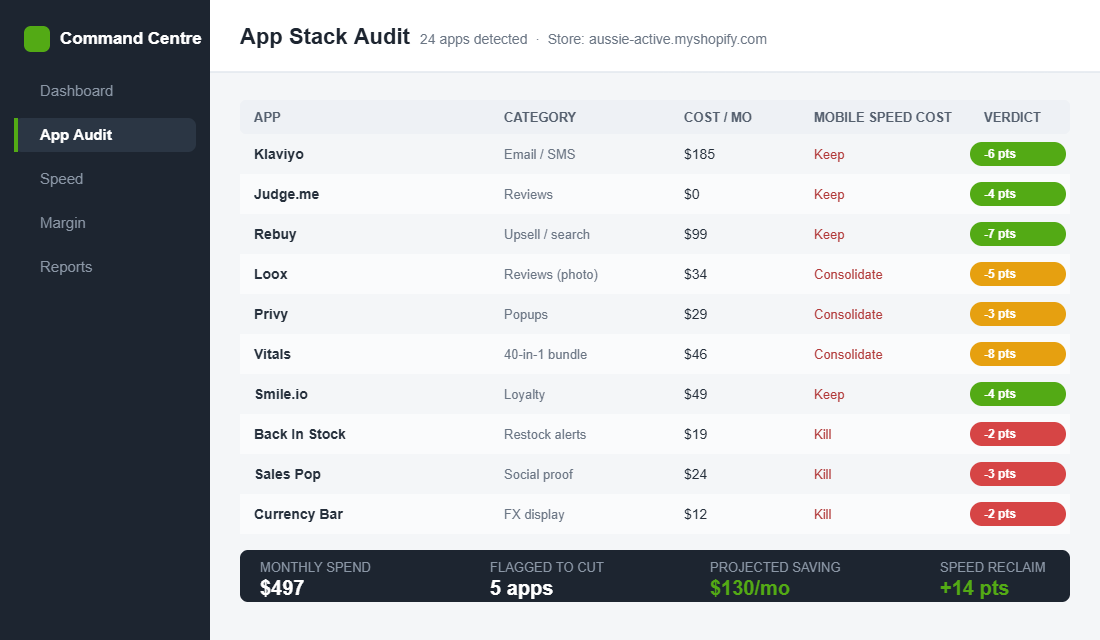
One warning while you build the list. Uninstalled apps often leave code behind, so an app you “removed” six months ago may still be firing script tags on your theme. We will deal with that residue at Stage 5, but note any app you have added and dropped in the past year. The goal here is a complete, honest inventory, not a tidy one.
Stage 2: Score Every App on the Keep, Consolidate, Kill Grid
Now you make decisions. Every app gets exactly one of three verdicts. Keep means it drives measurable revenue or saves real hours and has no cheaper equivalent. Consolidate means its job is already done, or could be done, by another tool you are paying for. Kill means you cannot point to a dollar it has earned in the last 90 days.
Score each app against four questions. Be ruthless, because “it might be useful” is how the drawer filled up in the first place.
- Revenue attributable. Can you tie this app to actual orders or retained customers? If the reporting is vague, that is usually your answer.
- Frequency of use. When did you or your team last open it? An app nobody has logged into for 30 days is a subscription, not a tool.
- Overlap. Does another app in your stack already do this, or a close-enough version of it?
- Front-end weight. Does it load scripts on storefront pages, or does it run quietly in the admin? Front-end apps get scored harder.
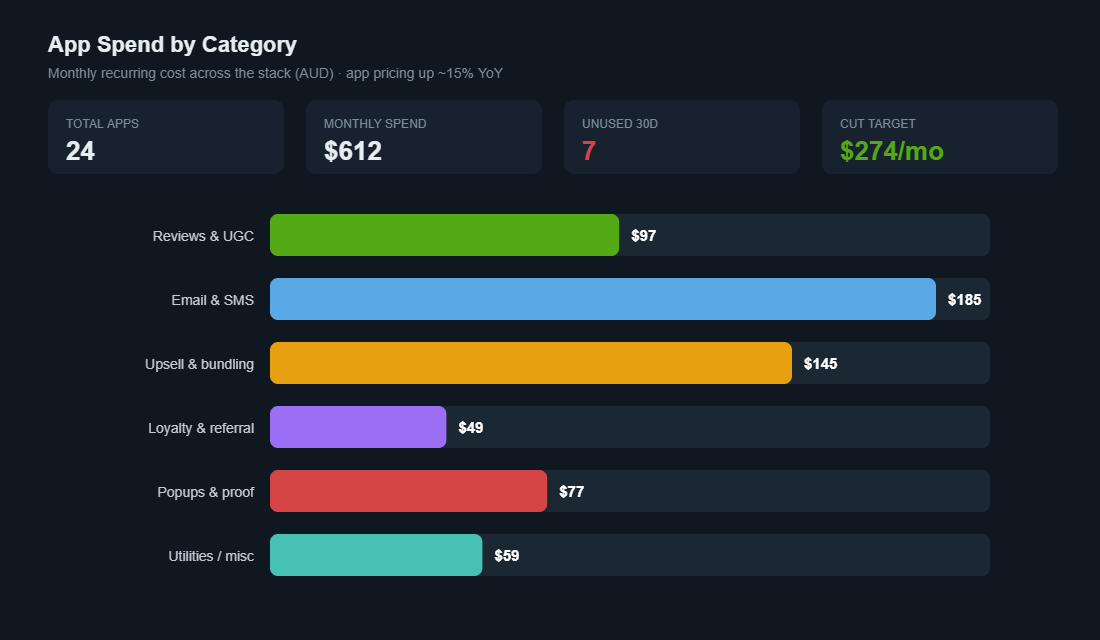
When you plot spend by category, the pattern is almost always the same. Reviews, upsell and popups eat the biggest share, and there is a cluster of low-value utilities quietly draining a few hundred dollars a year for nothing. This is the same discipline we apply to inventory in the Shopify Dead Stock Playbook. Dead apps are just dead stock on your P&L, without the shelf.
Stage 3: Find the Speed Thieves (Measure Before You Cut)
Feelings are not evidence, so before you kill anything, measure what each app actually costs the shopper. You do not need paid tooling for this. Two free instruments do the job.
Tool: Google PageSpeed Insights plus Chrome DevTools Coverage. Here is the exact setup:
- Step 1. Run your busiest product page through pagespeed.web.dev and record the mobile score, plus LCP, TBT and CLS. This is your baseline.
- Step 2. In Chrome, open DevTools (right-click, Inspect), press Cmd or Ctrl + Shift + P, type “Coverage” and hit enter to open the Coverage tab.
- Step 3. Click the reload icon inside Coverage and let the page load. You will see every JavaScript file, its source, and how much of it goes unused in red.
- Step 4. Sort by unused bytes. The app scripts sitting at the top with 70%+ unused code are your speed thieves. Match each file back to an app in your Stage 1 sheet.
- Step 5. Note the load cost against each app, then re-run PageSpeed after each removal so you can prove the recovery.
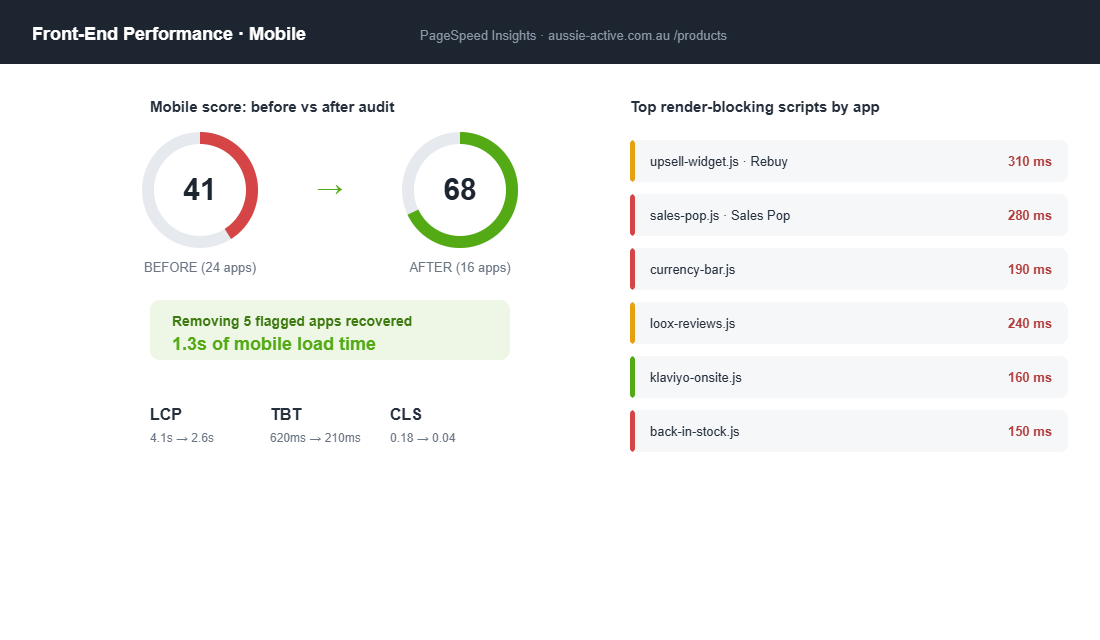
In a typical audit, pulling five flagged front-end apps recovers around a second of mobile load time and moves a mobile score from the low 40s into the high 60s. That is not cosmetic. On the conversion maths above, a full second of mobile speed is worth a double-digit lift in orders on the same traffic you are already paying for.
Stage 4: Consolidate Before You Cull
This is the stage that saves the most money, and it is the one founders skip. Before you kill an app for a feature you genuinely use, check whether a tool already in your stack, or a free Shopify-native feature, can absorb the job. Native features carry far less front-end weight than a third-party bolt-on, because they are built into the platform rather than injected on top of it.
- Shopify Search & Discovery is free and replaces most paid filtering and faceted-search apps.
- Shopify Forms handles email capture and popups, retiring a standalone popup subscription.
- Shopify Bundles covers basic fixed and multipack bundling without a dedicated bundle app.
- Klaviyo now runs email, SMS, forms and reviews from one platform, so a separate popup and a separate reviews app may both be redundant.
- Rebuy consolidates upsell, cross-sell, search and post-purchase offers, replacing two or three narrow single-purpose apps.
The rule is simple: one job, one tool. If two apps overlap by even 60%, one of them is a consolidation candidate. Every consolidation removes a subscription and a front-end script in the same move. As you trim, keep half an eye on the flow-on to margin, which is exactly the kind of number we pressure-test in the Shopify Price Testing Playbook. Lower fixed cost is margin you keep without touching your price.
Stage 5: Kill Properly (Remove the Residue)
Uninstalling an app in the Shopify admin does not reliably remove the code it injected into your theme. Popup apps, review widgets and social-proof tools frequently leave behind snippets, script tags and leftover theme.liquid edits that keep loading long after the subscription is cancelled. This is why a store can “remove” apps and see no speed gain at all.
Do it cleanly. Duplicate your live theme first so you always have a rollback. Then, in the theme code editor, search snippets and layout files for the app’s name or its script domain and remove the orphaned tags. Uninstall the app in the admin. Finally, re-run PageSpeed on a product page and a collection page to confirm the script is actually gone, not just hidden. If your comfort with theme code is thin, this is the one stage worth handing to a developer, because a wrong deletion can break a template.
The Compound Effect: A Lean Stack Is a Profit Lever
Here is where the pieces click together. A leaner stack is not one benefit, it is three, and they compound. You cut fixed monthly cost, which drops straight to the bottom line. You recover load time, which lifts conversion on the traffic you already have. And you reduce complexity, so the tools that remain are ones your team actually understands and uses.
Run the maths on a realistic store. Trim $130 a month in redundant apps and that is $1,560 a year in pure margin. Recover a second of mobile load and lift conversion even 10% on $80k of monthly revenue, and you have added $8,000 a month in sales without spending a cent more on ads. The subscription saving is nice. The conversion recovery is the real prize, and it is why app auditing belongs next to your customer economics work in the Shopify LTV Playbook.
Make this a quarterly habit, not a one-off panic. Apps accumulate the same way clutter does, one reasonable decision at a time. A 30-minute review every quarter keeps the drawer honest.
Your Takeaway: The KEEP App Audit Scorecard
Run every app in your store through these five checks. If it fails two or more, it is a consolidate or kill candidate. Save this and work it top to bottom next quarter.
- K — Known revenue. Can you attribute real orders or retention to it in the last 90 days?
- E — Exclusive job. Is it the only tool doing this task, with no overlap in your stack?
- E — Efficient load. Does it stay off the storefront, or load light when it is on it?
- P — Proven use. Has someone on the team opened or relied on it in the last 30 days?
- Cost check. Is what you pay each month clearly smaller than what it returns?
Inside eCommerce Circle, your app stack is one of the first things we audit with every member, because it is the fastest way to find both hidden cost and hidden speed in a store. If you want a second opinion on yours, let’s talk.