Look at your last 90 days of Shopify orders and count how many went out the door at full price. If you are like most Aussie stores sitting between $40k and $500k a month, the honest answer is somewhere under half. The store is busy. The revenue line looks alright. And yet the bank balance never quite reflects the volume moving through the warehouse.
What’s in This Article
That gap is discount dependency. It rarely arrives as a decision. It arrives as a welcome popup you set up two years ago, a cart recovery flow with 15 per cent baked into email three, a mid-season sale you ran because the numbers were soft, and an EOFY event you repeat because last year it worked. Each one is defensible on its own. Stacked together, they teach your customer a single lesson: never pay full price at this store.
The numbers on this are ugly. Roughly 50 to 60 per cent of promotions fail to deliver a positive return, and broad public coupon codes cannibalise 20 to 60 per cent of orders that were going to happen anyway. Full-price sell-through across fashion retail has slid from a 70 to 75 per cent norm down to around 50 per cent. Even Myer, with all its scale, guided FY26 operating gross margin down to about 39.2 per cent from 40.3 per cent after heavier than planned promotional activity. A full point of margin, gone, on billions of dollars of sales.
You cannot fix this with a decision to “discount less”. You fix it with an audit, a set of numbers, and a weaning schedule. Here is the one we run.
Step 1: Get Your Two Real Numbers (Penetration and Depth)
Almost every founder I talk to can quote their revenue and their ROAS. Almost none can quote their discount penetration. It is the single most diagnostic number in this whole exercise and it takes twenty minutes to pull.
- Discount penetration. The percentage of orders in the last 12 months that used any discount code or automatic discount. Under 40 per cent is manageable. Over 60 per cent and the discount is no longer a promotion, it is your price.
- Discounted revenue share. The percentage of total revenue that came from discounted orders. Above 30 to 40 per cent is the dependency threshold.
- Average discount depth. Total discount dollars divided by gross sales on discounted orders. Anything over 22 per cent is a danger zone on typical DTC margins.
- Full-price sell-through. The percentage of each season or drop sold before your first markdown. Mid-market apparel should be hitting 65 to 75 per cent. Premium sits at 50 to 65 per cent.
In Shopify, pull Analytics > Reports > Sales by discount for a rolling 12 months. Export to CSV, drop it next to a total orders and total sales export for the same window, and the four numbers fall out in one pivot. Set a calendar reminder to redo this on the first Monday of every month. It takes fifteen minutes once the sheet exists.
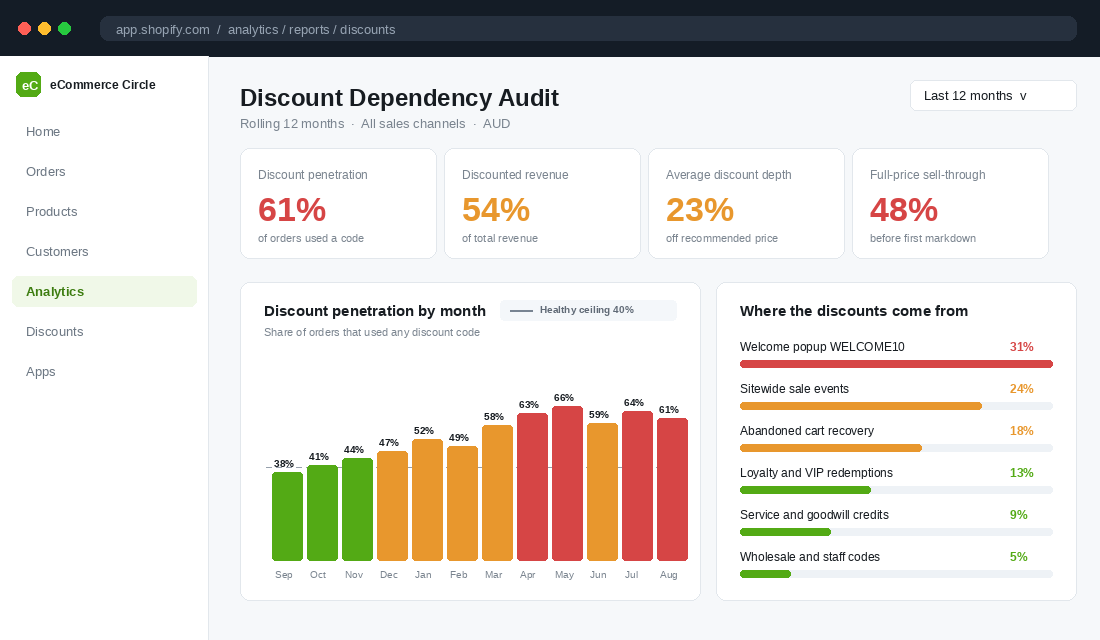
The trend matters more than the level. A store sitting flat at 45 per cent penetration has a habit. A store that has climbed from 38 to 61 per cent in twelve months has a slide, and slides accelerate. Every month you add a code, the baseline resets higher.
Step 2: Work Out What Every Percentage Point Actually Costs
Most founders price discounts off the retail number and never check what is left after the real costs land. This is where the damage hides.
Take a product at 100 dollars retail with a 35 dollar cost of goods. That is a 65 per cent gross margin, which sounds healthy. Now subtract 12 dollars of freight and packaging, 2.20 in payment processing, and 4 dollars of pick and pack. You are at 46.80 contribution before a cent of advertising. Run a 25 per cent off code and the retail drops to 75, but your COGS, freight, pick and pack do not move. Contribution falls to 22.30. You just gave away 52 per cent of your contribution to save the customer 25 per cent.
That is the maths that catches people out. On products carrying 20 to 30 per cent gross margins, a discount above 25 to 30 per cent wipes out profit entirely. You are shipping boxes for the pleasure of it.
Build a break-even volume line into the same sheet. To stand still on contribution at a 25 per cent discount in the example above, you need 2.1 times the unit volume. Ask yourself honestly whether your last sitewide sale did double the units of a normal week. Most do not come close. If you want the full framework for this, we walk through it in the contribution margin playbook.
Step 3: Rank Every Code by Contribution, Not Revenue
Now you go code by code. This is the part that changes minds in a leadership meeting, because it shows that your biggest revenue driver is often your worst profit driver.
Build one row per active code with orders, gross revenue, discount dollars given away, and contribution after COGS, freight and payment fees. Then assign each code one of three verdicts.
- Keep. The code is earning its keep. Loyalty tier redemptions, structured multi-buy bundles and birthday flows usually land here because they are targeted and they lift order value rather than just cutting price.
- Reduce. The code works but the depth is wrong. Cart recovery at 15 per cent almost always converts at 10 with barely any drop in recovery rate. Test the step down before you kill it.
- Cut. The code is cannibalising orders you were getting anyway. Sitewide percentage-off events and stale welcome codes dominate this bucket.
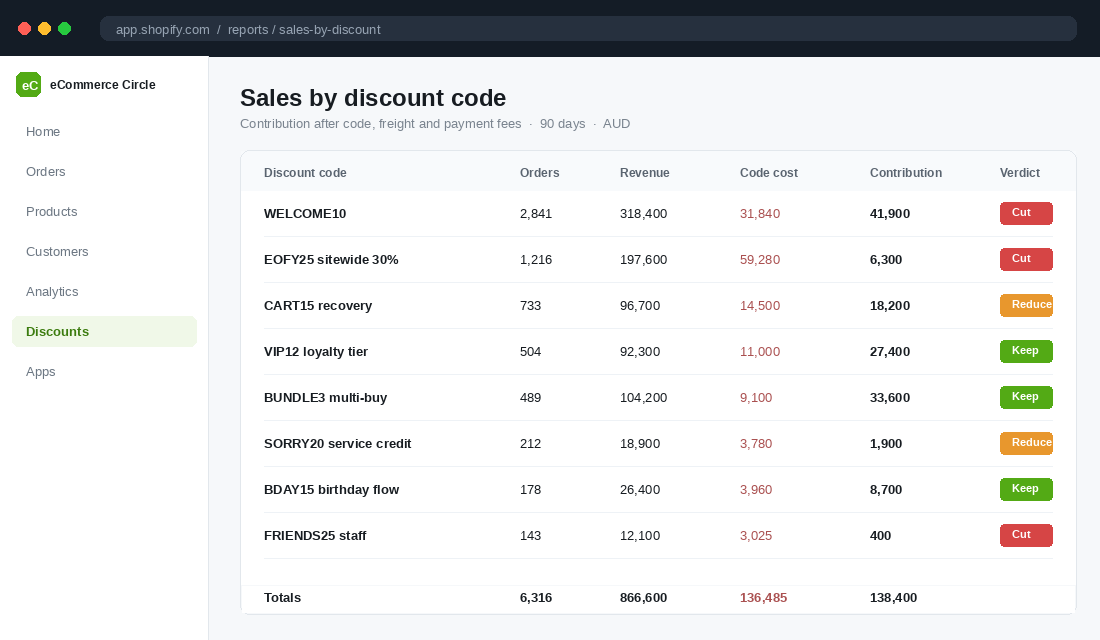
Notice the pattern in that table. The sitewide 30 per cent event pulled 197,600 in revenue and returned 6,300 in contribution. The bundle code did half the revenue and returned more than five times the profit. Targeted offers cannibalise at only 10 to 25 per cent, against 20 to 60 per cent for broad public coupons. Specificity is the whole game.
Step 4: Segment Your Customers by Price Behaviour
Codes are only half the picture. The other half is who you have recruited. Split your customer base into three groups based on their purchase history: those who have only ever bought at full price, those who mix, and those who have never once paid full price.
Do this in Klaviyo with a simple segment. Create a segment where Placed Order where Discount Code is set, at least once over all time, and a mirrored segment where it has been set zero times. Add a third for customers where every order carried a code. Give it five minutes of setup and you will have a permanent lens on your base.
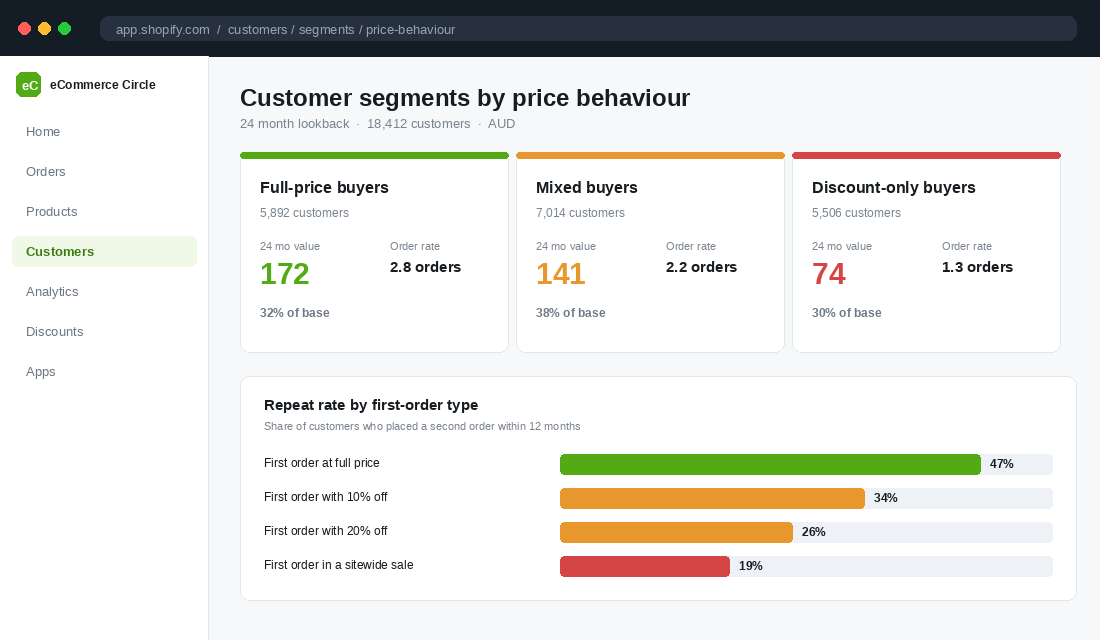
The pattern shows up in almost every store we audit. Discount-only buyers sit at less than half the 24 month value of full-price buyers and they order about half as often. They are not cheaper customers. They are worse customers, and you paid the same acquisition cost to get them.
This is the argument that finally lands with founders who are nervous about pulling codes. You are not choosing between revenue and profit. You are choosing which customer base you want to be running in three years. Stores that lean on sitewide percentage-off events see an average 18 per cent drop in full-price sell-through within six months. The habit compounds against you.
Step 5: Kill the Always-On Discounts Before You Touch the Events
Founders instinctively want to start by cancelling a sale. Wrong order. Sale events are visible and emotional. The always-on codes are invisible and they do most of the damage, because they apply to traffic that was already going to convert.
Attack them in this sequence.
- The welcome popup. Usually the single largest discount line in the business. Swap the flat 10 or 15 per cent off for free express shipping on the first order, a sample or sachet with first purchase, or early access to new drops. Run it as a proper split test for four weeks and watch capture rate and first-order conversion, not just one of them.
- Cart and browse abandonment codes. Move the discount from email one to email three. Most of the recovery happens on the reminder itself, not the offer. Then test dropping the depth by five points.
- Sitewide codes living in your footer or FAQ. Search your own site for the word “code”. Anything a customer can find in ten seconds is not a promotion.
- Codes that have leaked to coupon aggregators. Search your brand name plus “discount code” in a private window. If Honey or a coupon site is surfacing a working code, every checkout with that extension installed is quietly costing you 10 to 15 points of contribution.
Set every remaining code to single use per customer, exclude new-season and hero products, and add expiry dates to everything. A code without an expiry date is a permanent price change with extra steps.
Step 6: Replace Discount Value With Non-Price Value
You cannot simply remove value from the offer and hope conversion holds. You have to put something back that costs you less than the discount did. This is where most weaning attempts fall over, because founders pull the code and leave a hole.
The swaps that work best for Aussie stores, roughly in order of return per dollar of margin given up:
- Free express shipping over a threshold. Costs you 9 to 14 dollars on a metro Sydney or Melbourne delivery instead of 20 to 30 dollars on a percentage discount, and it lifts average order value at the same time.
- A gift with purchase. A 6 dollar cost item reads as a 25 dollar value on the product page. Pound for pound it is the best swap available to most brands.
- Extended warranty or a longer returns window. Costs you a small claims provision, removes a real objection, and no competitor can match it with a code.
- Bundles and multi-buy. Discount the third unit, not the first. You lift order value and never train a single-item buyer to wait.
- Access and timing. Early access to a drop, member-only sizes, a restock notification before the public. Costs nothing and builds the exact behaviour you want.
Price is the only lever a competitor can copy in an afternoon. Everything on that list takes them months. That is the whole strategic case, and it is why taking a price rise properly often does more for a business than any campaign.
Step 7: Rebuild the Calendar With Fewer, Sharper Events
Once the always-on leaks are plugged, rebuild the promotional year deliberately. The goal is not zero promotions. It is a small number of events your customer cannot predict their way around.
Three or four events a year is the right shape for most Aussie DTC brands. Black Friday and Cyber Monday, one EOFY or stocktake clearance, and one or two brand-specific moments such as a birthday sale or an end-of-season run out. Everything else becomes a targeted offer to a defined segment, not a public code.
- Vary the mechanic, not just the date. If every event is percentage off, customers learn the pattern. Rotate between gift with purchase, tiered spend thresholds, bundle pricing and genuine clearance on end-of-life stock.
- Discount stock, not the brand. Clearance should point at specific SKUs you are exiting. Sitewide says everything you sell was overpriced.
- Use small, sell-through-triggered markdowns. A first markdown of 10 to 25 per cent triggered when a line hits a sell-through threshold, with only two or three steps a season, protects far more margin than one deep clearance at the end.
- Cap the depth in writing. Agree a maximum discount depth per category before the season starts, based on the contribution maths from step 2. Written rules survive a soft trading week. Good intentions do not.
If BFCM is the event you are most nervous about protecting, the offer architecture we use gets you a strong result without a sitewide percentage.
The 90-Day Weaning Schedule
Here is where the pieces come together. Do not do this in one move. A store above 70 per cent penetration with deep average discounts typically needs 12 to 18 months to fully rebuild pricing power without cratering revenue. A store under 40 per cent can often move inside a single quarter. The schedule below is the first 90 days either way.
- Days 1 to 14. Measure. Pull the four numbers. Build the code-level contribution table. Create the three Klaviyo price-behaviour segments. Change nothing yet. You need a clean baseline to argue from later.
- Days 15 to 30. Plug the leaks. Expire dead codes, set single-use limits, exclude hero and new-season products, hunt down leaked codes on aggregator sites. This is pure margin recovery with almost no conversion risk.
- Days 31 to 60. Swap the welcome offer. Split test the popup: existing percentage code against free express shipping or a gift with purchase. Judge it on first-order contribution and 90 day repeat rate, not capture rate alone.
- Days 61 to 75. Step down the flows. Reduce cart recovery depth by five points and move the offer later in the sequence. Measure recovery rate weekly. If it holds, step down again next quarter.
- Days 76 to 90. Rebuild the calendar. Lock the next 12 months to three or four events with varied mechanics and written depth caps. Publish it internally so nobody can add a sale on a slow Tuesday.
Expect a wobble around week five or six. Revenue dips slightly as the deal-seeking segment stops converting. That is the point. Those orders were costing you contribution. What you should see by day 90 is penetration down 10 to 15 points, average order value up, and contribution per order climbing even on flat top-line revenue.
The compound effect is the real prize. Every point of penetration you remove does three things at once. It puts contribution straight back on the bottom line. It stops recruiting the low-value customer profile that drags your 24 month value down. And it restores your ability to run a genuine promotion that actually moves stock when you need it to, because scarcity of discount is what makes a discount work.
Run the audit this week. Fifteen minutes in a spreadsheet will tell you whether you are running a brand with promotions or a permanent sale with a logo on it. Once you can see it, the rest is just discipline on a calendar. If price testing is your next move, the price testing playbook pairs neatly with this one.
Worked Example: A $310K-a-Month Aussie Fashion Brand Gets Off the 30% Treadmill
Imagine you run a Melbourne womenswear brand doing about $310K a month. Discount penetration is 71%, average depth is 28%, and there has been a site-wide sale live for 41 of the last 52 weeks. Contribution margin sits at 14% and the founder cannot work out why growth never turns into cash. The Shopify discount report shows the always-on 10% welcome code, a 20% “VIP” code that has leaked to every coupon site in Australia, and a rolling 30% clearance banner that has quietly become the price.
The 90-day weaning schedule in this playbook ran from February to April, deliberately outside the peak window. The leaked VIP code was killed on day one. Welcome went from 10% off to free shipping plus early access. The clearance banner was replaced with a proper two-week end-of-season event with a hard finish. New non-price value was added: free returns on full-price orders, a fit guarantee, and a members-only preview.
- Discount penetration fell from 71% to 34% by the end of the third month, with depth on the remaining discounted orders down from 28% to 19%.
- Revenue dipped 9% in month one and recovered to 2% above the prior quarter by month three, as the full-price customer segment, which had been 22% of buyers, grew to 41%.
- Contribution margin rose from 14% to 23%, worth roughly $28K a month in cash the business had been giving away to people who would have bought anyway.
- Returns on full-price orders rose from 11% to 13% with the free-returns offer, a cost of about $4K a month against the $28K gain. Worth it, and worth tracking.
- Email revenue per recipient went up 31%, because campaigns finally had something to say other than a percentage.
The founder’s biggest surprise was how few customers noticed. The “loyal” discount segment that everyone feared losing turned out to be 60% one-time buyers from coupon sites. If you want to run the same maths on your own store before you commit, the contribution margin playbook gives you the per-order calculation to build it on.
The Discount Benchmarks That Tell You Where You Stand
Discount dependency is a spectrum, and most Aussie Shopify founders have no idea where on it they sit because Shopify does not report it in one place. Pull the Sales by discount report and the Orders export, then score yourself against these ranges. They are drawn from Aussie DTC brands between $40K and $1m a month, with fashion and beauty at the high end and consumables at the low end.
- Discount penetration: under 30% of orders is healthy for most categories; 30 to 50% is drifting; over 50% means the discount has become the price.
- Average discount depth: 10 to 15% on discounted orders. Above 25% average depth, the codes are doing the selling and the brand is not.
- Full-price customer share: at least 40% of buyers in a quarter should have never used a code. Below 25%, your acquisition is training people to wait.
- Always-on discount count: zero. A welcome incentive that is a discount rather than a value-add counts as always-on.
- Sale weeks per year: 6 to 10, including BFCM and end-of-season. Above 20 weeks a year, “sale” has stopped meaning anything to your list.
If two or more of these are in the red zone, start with the always-on codes, because they are the cheapest to fix and the fastest to show up in margin. Then rebuild the calendar with the five-tier structure in the discount discipline framework, and use a loyalty program built on the loyalty program maths to give your best customers a reason to stay that does not come off the top line.
Inside eCommerce Circle, pricing discipline is one of the core pillars we work on with every member, because it is the fastest profit lever most stores are not pulling. If you want a second opinion on your discount numbers, let’s talk.