There is one number in your analytics that decides whether your email flows, your ad budget and your discount timing are aimed at real people or at a statistical ghost. It is not conversion rate. It is not average order value. It is the gap between the first time someone lands on your store and the moment they actually pay.
What’s in This Article
Most Aussie founders assume that gap is tiny. Someone clicks the ad, browses, buys or leaves. The data says otherwise. Across ecommerce stores, new visitors typically take two to three days to make a first purchase, and around 90% of conversions land by day 12. That is not one behaviour. That is at least two behaviours stacked on top of each other, and if you build a single sequence for both you will underserve both.
I call this the consideration window: the real distribution of time between first touch and first order for your store, split by the things that actually change it. Get it right and your flows, your retargeting duration and your offer timing all start pulling in the same direction. Get it wrong and you spend money nudging people who already bought, while the people still deciding hear nothing from you on the day they were ready.
Why the Average Is the Most Dangerous Number in Your Analytics
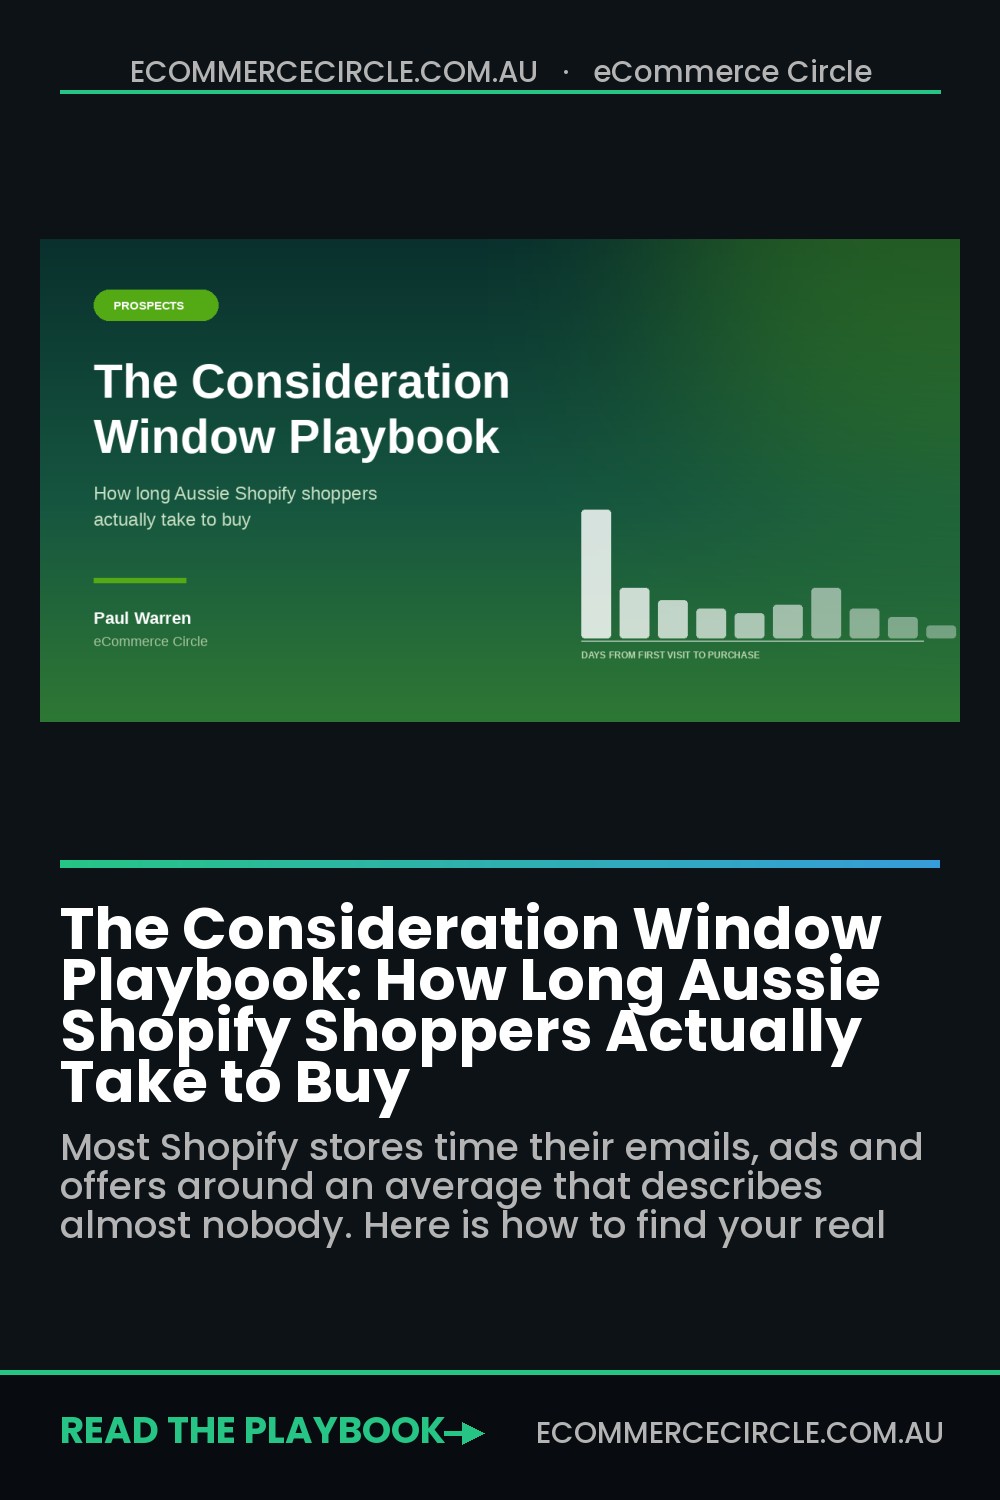
Time to purchase is never a bell curve. It is a spike followed by a long, thin tail. A big chunk of your orders happen in the first session. Then the volume collapses. Then a smaller, stubborn group keeps trickling in for weeks.
On a typical Aussie store selling in the 100 to 300 dollar range, the shape looks something like this: median 2 days, mean 7.8 days, 90th percentile 18 days. Those three numbers describe the same customers and they tell completely different stories.
The mean is the trap. Nobody buys at 7.8 days. That number is a fiction created by a handful of people who took six weeks to commit. If you build your welcome sequence around it, you send your closing email to people who bought on day one and your urgency email to people who are still ten days from deciding.
This matters more now than it did three years ago. Australians spent 82.6 billion dollars online in 2025, up 14% year on year, but the average basket dropped to 96 dollars. More transactions, smaller spends, sharper focus on value. People are shopping more often and comparing harder, which stretches the tail even on products that used to be impulse buys.
It also explains a gap most founders never close. First-time visitors convert at roughly 1.0 to 2.0%, while repeat visitors convert at 4.5 to 6.0%. The difference is not that repeat visitors are better people. It is that they came back inside a window you either supported or ignored.
Step 1: Pull Your Real Window Out of GA4
You do not need a data team for this. You need fifteen minutes and a GA4 property that has ecommerce tracking working.
- Open Advertising, then Attribution, then Conversion paths. In some properties this is labelled Attribution paths. Same report.
- Set the conversion event to Purchase. If you leave it on all events, add-to-cart and sign-ups will pollute the read.
- Set the date range to the last 90 days. Anything shorter and seasonality distorts it. Anything longer and you are measuring a version of your store that no longer exists.
- Scroll to Days to conversion and Touchpoints to conversion. These two charts sit underneath the channel table and most people never scroll far enough to see them.
- Widen the path length. The default view caps at 20 touchpoints. You can extend it to 50 if you have a long sales cycle, though most Shopify stores will not need to.
Write down three numbers and nothing else: the median, the mean, and the 90th percentile. The median tells you when half your buyers have committed. The 90th percentile tells you when it is safe to stop spending on someone. The mean is only there so you can see how badly it lies.
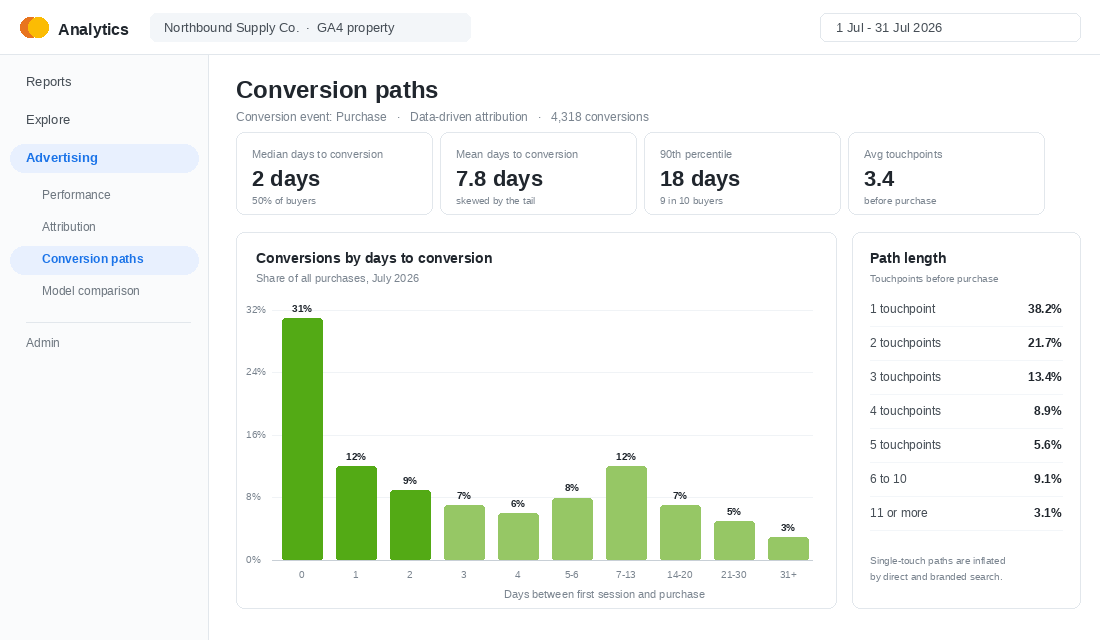
One honest caveat. GA4 undercounts here because of consent banners, cross-device behaviour and cookie expiry. Someone who browses on their phone at lunch and buys on a laptop that night can show as a same-session purchase. Treat this as directionally right, not precisely right. You are looking for the shape of the curve, not four decimal places.
If you want a sanity check, export your Shopify customer list with first order date and compare it against your Klaviyo profile creation date. The gap between “joined the list” and “placed first order” is a second, blunter read on the same behaviour, and it does not depend on cookies at all.
Step 2: Split the Curve Into Two Different Businesses
A single store-wide window is better than nothing, but it still averages away the thing you need. The moment you cut the data, the curve breaks into groups that behave nothing like each other.
Cut it four ways, in this order of importance:
- Price band. This is the biggest lever by a wide margin. On most Aussie stores, orders under 100 dollars have a median of zero days while orders over 500 dollars sit closer to three or four weeks. Same store, same brand, two completely different buying processes.
- Traffic source. Branded search, direct and email are late-stage channels. Those people have usually already done their thinking somewhere else, so their window looks short. Cold Meta and TikTok traffic sits at the other end. If you judge prospecting on the same clock as retargeting, prospecting will always look worse than it is.
- New versus returning. Returning visitors compress the window because the trust work is already done. This is why the second visit is worth so much more than the first.
- Gift versus self-purchase. Gift buyers move on a deadline, not a preference. Their window is set by Mother’s Day or a birthday, not by how much they like your product.
Once you have cut it, name the two cohorts out loud and write down the split. Something like: “62% of our buyers decide within 48 hours. 24% take more than a week.” Those two sentences will drive every decision in the rest of this playbook.
It also helps to line this up against where people sit in their own decision process. If you have not mapped that yet, the customer awareness stages framework is the fastest way to work out why one cohort moves in a day and the other takes a fortnight.
Step 3: Ask the Question Your Analytics Cannot Answer
GA4 tells you how long people took. It cannot tell you what they were doing during that time, or what finally tipped them. For that you have to ask.
Install KnoCommerce or Fairing on your Shopify thank-you page. Both plug straight into checkout extensibility, take about ten minutes to set up, and typically pull a response rate around 45%, which is far higher than anything you will get from an emailed survey.
- Install the app and enable it on the order status page. In Shopify admin go to Settings, then Checkout, then Order status page, and confirm the app block is active.
- Set question one as a single-select. “How long were you thinking about this purchase before you bought?” with five options: bought on first visit, a few days, about a week, two to four weeks, more than a month.
- Set question two as a conditional free text. Trigger it only for people who answered anything longer than “a few days”, and ask “What finally made you decide?”
- Stop at two questions. Every extra question drops your completion rate. You are not running a research panel, you are catching one insight at the moment of highest attention.
- Export weekly and join it to order value. The survey answer on its own is interesting. Matched to what they actually spent, it is a planning document.
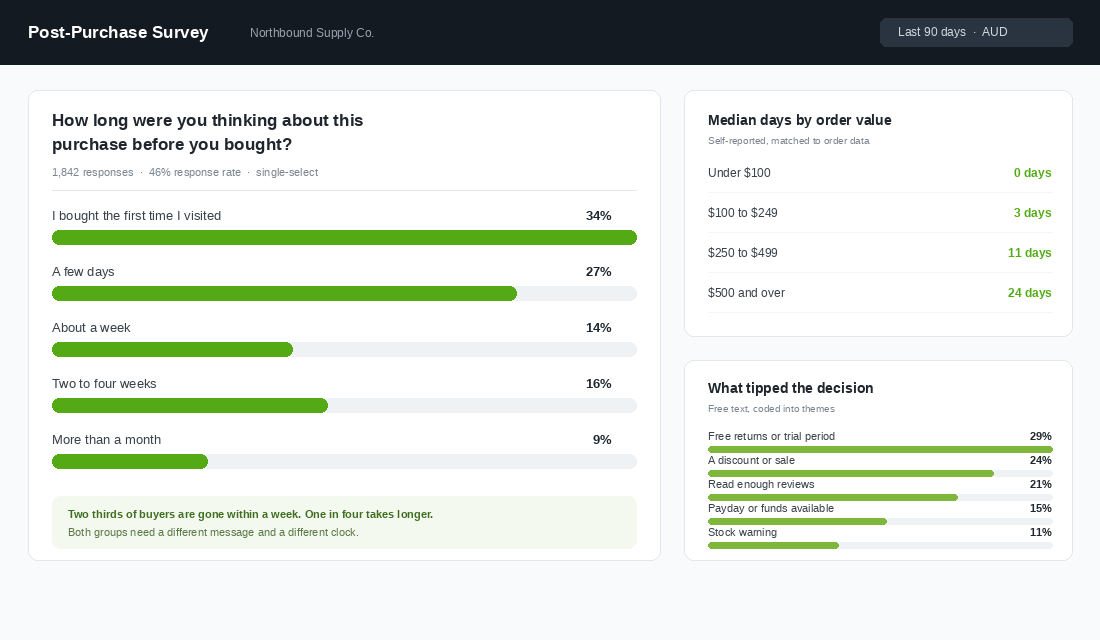
The tipping-point answers are where the money is. When free returns or a trial period is the most-cited trigger, that is a sign your considerers are stuck on risk, not price, and another 10% off will not move them. When “payday” shows up in the free text, your problem is timing, not persuasion.
If you want the full question bank and the way to run this without annoying customers, we covered it in the post-purchase survey playbook.
Step 4: Retime Your Flows to the Curve, Not the Calendar
Almost every Shopify store runs default flow timing that came out of the box in 2019. Klaviyo’s standard abandoned cart starts at roughly four hours with follow-ups near 24 and 48 to 72 hours. That is a reasonable starting point, not a finished setting.
Here is how to rebuild the timing around your own numbers.
- Anchor the first touch to the session, not the clock. Four hours works because the median shopper is still browsing. Do not push this out to a day. You lose the people who were one nudge away.
- Anchor the last touch to your 90th percentile. If 90% of your buyers have converted by day 18, a flow that stops at day three abandons the entire tail. Add a low-pressure touch at day 7 and another at day 14.
- Split the flow on price band. A conditional split on the value of the last product viewed lets your under-250 branch run tight and your over-250 branch run long, inside one flow.
- Extend the welcome sequence, do not compress it. Most welcome flows fire five emails in four days and then go silent. If your window is 18 days, you have just gone quiet during the exact period when half your considerers were making up their minds.
- Never discount before the median. If half your buyers convert by day two, a discount that fires at hour six is paying people who were already going to buy. Move the offer past the median and it only reaches people who genuinely stalled.
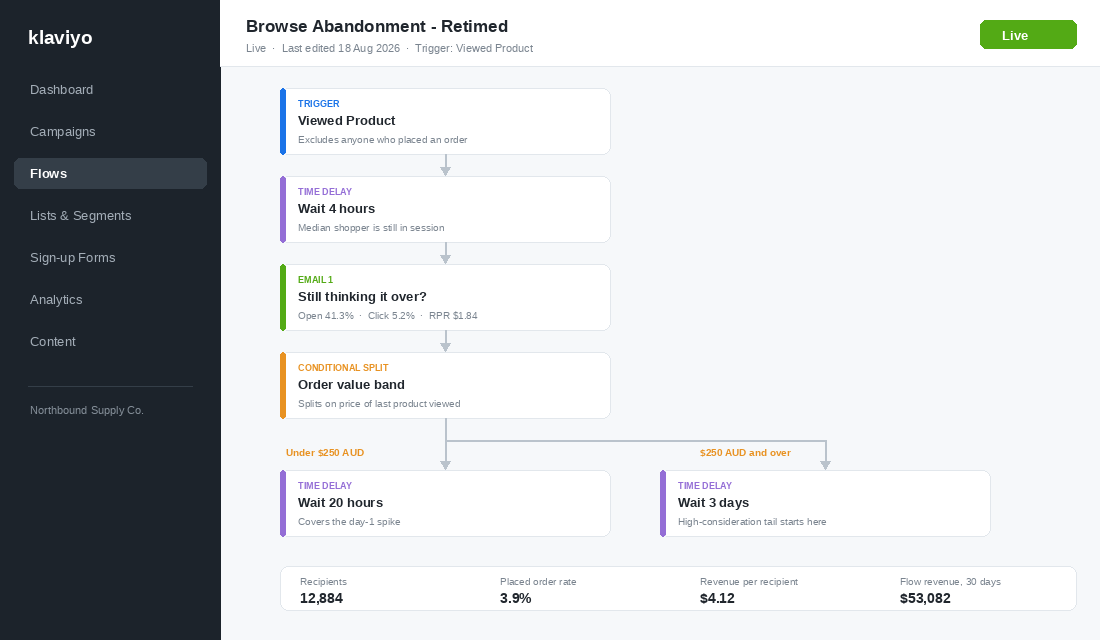
Browse abandonment is the flow most worth fixing here, because it catches people at the front of the window rather than the end. Klaviyo’s own benchmarks put browse abandonment at around a 38.9% open rate and a 4.9% click rate, which is strong attention for a message most stores either do not run or run once and forget.
For context on what good looks like at the other end, cart abandonment recovery sits at roughly 8 to 12% for top-performing stores. If yours is well under that, timing is usually the first thing to check before you rewrite a single subject line.
Step 5: Match Your Ad Windows to the Same Clock
This is where the consideration window stops being an email problem and starts being a budget problem.
Meta now reports on 1-day click, 7-day click and 1-day view. The 28-day view-through window was retired as a reporting option in March 2026, which quietly shortened the credit window for every brand selling a considered purchase.
- If your 90th percentile is longer than seven days, expect prospecting to look worse than it is. Your top-of-funnel campaigns are doing work that gets credited to retargeting and branded search a fortnight later. Do not cut prospecting budget on that read alone.
- Set retargeting audience duration to roughly your 90th percentile. Not the default 30 days. If your tail ends at 18 days, a 30-day audience is burning spend on people who already decided against you. If your tail runs to 45 days, a 14-day audience drops people right before they were going to buy.
- Divide frequency across the window, not across the week. A shopper with an 18-day window who sees your retargeting ad nine times in four days is not being persuaded, they are being annoyed.
- Change the message by position in the window. Days one to two should answer product questions. Days three to seven should answer risk questions like sizing, delivery and returns. Anything past day seven is a different conversation entirely, and that is where an offer earns its place.
The structural side of this, including how to build the audiences and stop retargeting eating your prospecting results, is covered in the Shopify retargeting playbook.
The Australian Wrinkle: Pay Cycles, Trials and the Fortnight
Here is something that does not show up in any American benchmark you will read. Australia runs on fortnightly pay, and our shopping behaviour follows it.
Australia Post’s 2026 eCommerce Report found that 41% of households now shop online at least fortnightly, and that 47% of Millennials buy online weekly or more against an average of 35% across all shoppers. For a lot of stores, the consideration window is not really a decision window. It is a waiting-for-payday window.
Test it in an afternoon. Export your orders for the last 90 days, plot them by day of week and by day of month, and look for repeating peaks. If you see a reliable Thursday or Friday lift, that is your customers’ pay cycle showing up in your revenue, and it should be setting your campaign send times and your final flow email.
Two more Australian levers worth pulling:
- Buy now pay later shortens the perceived window on high-ticket items. Afterpay and Zip messaging on the product page moves the decision from “can I afford this now” to “can I afford a quarter of this now”. On a 400 dollar product that can pull a considerer forward by a full pay cycle.
- Trial length is a consideration-window lever, not just a returns policy. Koala built its category position on a 120-night trial, and 100 to 150 night trials are now standard across Australian mattress brands. That is not generosity. It is a deliberate move to take the decision risk off the customer so they stop researching and start sleeping on it, literally.
Friction stretches the window too, and site experience is the cheapest place to shorten it. When Australian fashion label Aje replatformed to Shopify Plus, its conversion rate jumped 135% within weeks of migrating. None of those shoppers suddenly needed the product more. The store simply stopped giving them reasons to go away and think about it.
The Compound Effect: One Clock Across Every Channel
Any one of these changes is worth a small lift. The reason to do all five is that they stop fighting each other.
Picture the current state on a typical store. The welcome flow finishes on day four. Retargeting runs on a 30-day audience with no message change. The discount fires at hour six. Meta is optimising on a 7-day click window. Every one of those settings assumes a different customer timeline, and none of them matches the real one.
Now picture them aligned to a single measured window. The first touch lands while the shopper is still in session. The risk-reversal message lands on day three, when the survey says risk is the blocker. The offer lands on day eight, past the median, so it only reaches genuine fence-sitters. Retargeting switches off at day 18 instead of day 30, and that saved budget goes back into prospecting. The flow keeps talking until day 14 instead of going silent on day four.
Nothing in that list is a new channel, a new app or a bigger budget. It is the same spend, aimed at when people are actually deciding. On the browse flow alone, moving from a single three-day sequence to a price-split sequence that runs to day seven is usually worth a double-digit percentage lift in flow revenue, because you finally reach the quarter of your buyers who were never in a hurry.
Your Consideration Window Worksheet
Copy these seven lines into a doc and fill them in this week. Once they are written down, every timing decision on your store has an answer.
- Median days to purchase: ____ (from GA4 Conversion paths, last 90 days)
- 90th percentile days to purchase: ____ (this is your cut-off for every paid audience)
- Share of buyers converting on first visit: ____% (your impulse cohort)
- Share of buyers taking more than seven days: ____% (your considerer cohort)
- Median days for your top price band: ____ (this sets the long branch of every flow)
- Most-cited tipping point from the survey: ____________ (risk, price, timing or stock)
- Day of the week your orders peak: ____________ (send campaigns the morning of, not after)
Then apply the three rules that fall out of it. First touch inside the session. Offer after the median, never before. Everything switches off at the 90th percentile.
Most stores are not losing sales because their product is wrong or their creative is tired. They are losing sales because they show up loudly on day one, go quiet on day four, and keep paying for impressions on day 29. Fix the clock and a surprising number of other problems fix themselves.
Inside eCommerce Circle, knowing your prospects well enough to time the offer is one of the core pillars we work on with every member. If you want a second opinion on your consideration window, let’s talk.