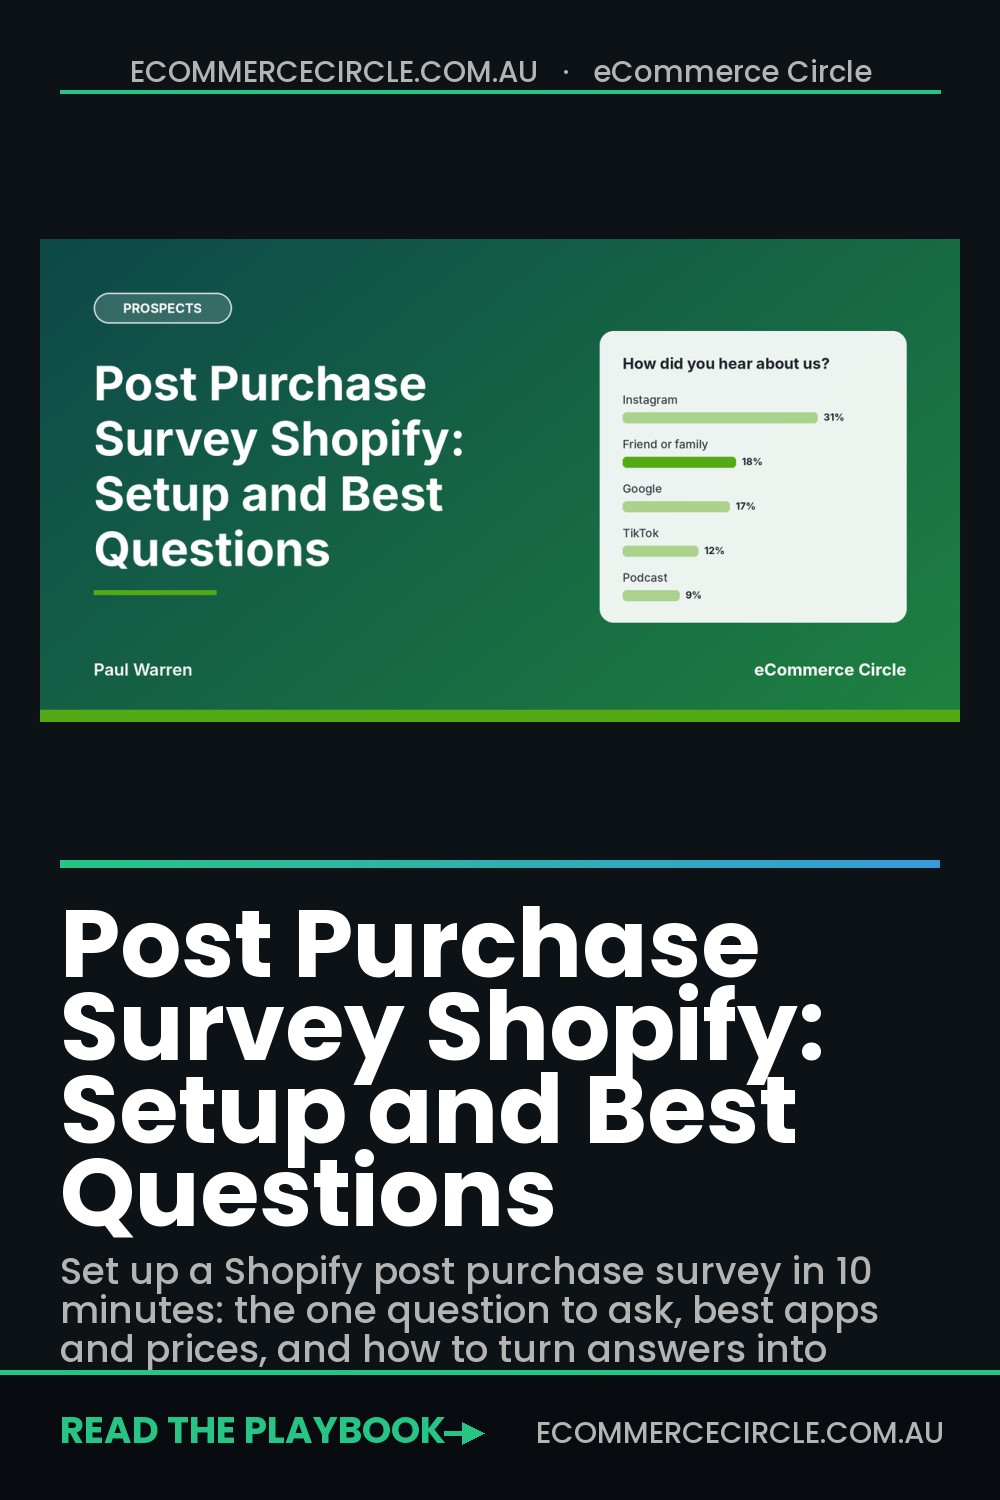
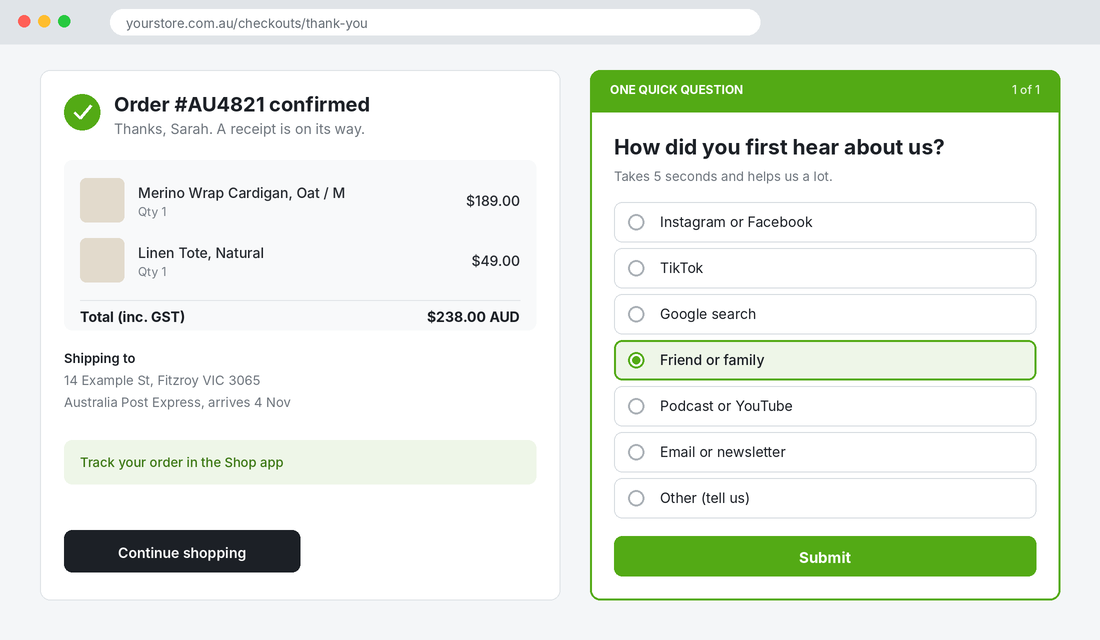
A post purchase survey on Shopify is a one-question form on your thank-you page that asks new customers how they found you. The best question is “How did you first hear about us?”, it takes five seconds to answer, and it shows you the channels your ad platforms cannot see.
Here is the problem it fixes. Meta says it drove 57% of last month’s sales. Google says 15%. Klaviyo says 14%. Add those up and you have credit for 86% of revenue before you count a single friend who texted a link, a podcast mention, or a TikTok someone saw three weeks ago. According to a 2026 write-up from Purposeful Profits, platform-reported revenue added together often exceeds actual Shopify orders by 30 to 100%. Every platform is grading its own homework.
A survey asks the one person who knows the answer: the customer. It is free to start, it takes about 10 minutes to install, and most Aussie stores that run one find at least one channel they were badly underrating. This guide walks through the exact setup, the questions worth asking, the tools and what they cost, and how to turn the answers into budget and conversion decisions.
Why a Post Purchase Survey Beats Another Attribution Tool
Pixels and click tracking only record what happens inside a browser. They miss the conversation in a group chat, the podcast on the drive to work, the creator video watched on one phone and bought on another. Safari and iOS privacy settings clip the data further. What you end up with is a report that is confident and incomplete.
A survey records memory instead of clicks. That has its own flaws (more on those below), but it captures a different slice of reality, and the two views together are far more useful than either alone. The team at TrueROAS shared a simple example: a brand added a “how did you hear about us?” box and within a month 14% of answers said “podcast”, even though the brand had never bought a podcast ad. A founder had mentioned the store on one episode, twice.
That is the kind of finding you cannot get from your ad account. It also changes decisions. If a channel you do not pay for is quietly sending you buyers, you want to know before you cut the activity behind it.
If you have read our guide to blended ROAS, think of the survey as the missing input. Blended numbers tell you what you spent against what you earned. The survey tells you who and what sent those buyers in the first place.
What Response Rate to Expect (and Why Placement Decides It)
Where you ask matters more than how well you word the question. Surveys placed on the order confirmation page see far higher response than anything sent by email. A breakdown from AdsX puts confirmation-page surveys at 40 to 75% response and post-purchase email surveys at 5 to 15%. TrueROAS says a single question on the thank-you page typically gets 20 to 40%, so treat the upper numbers as vendor best case.
Planning around the lower range is safer. If you get 600 orders a month and 25% answer, that is 150 responses every 30 days, which is plenty to spot a pattern. One consultancy suggests that clear themes show up once you pass roughly 200 answers to a question.
Length is the other lever. The same source argues that two questions held at a 40 to 50% completion rate are worth more than five questions that drop to 10%. Agree with that. Start with one question, add a second only after you are happy with the first.
| Placement | Typical response | Best for |
|---|---|---|
| Thank-you page, inline | 20 to 75% (use 25 to 40% for planning) | Attribution and one follow-up question |
| Thank-you page, delayed pop-up | Lower and patchy | Avoid. Customers close it before it loads |
| Post-purchase email | 5 to 15% | Longer research surveys and product feedback |
| Pop-up on the site | Varies, mostly browsers not buyers | Non-buyer research, not attribution |
The Question to Ask First (and the Wording That Gets Honest Answers)
For attribution, start with one single-select question. Fairing, the most widely used survey app, lists the standard options in its setup guide:
- “How did you hear about us?” The general starting point. Good if you want a broad read.
- “How did you first hear about us?” Use this when you care about top-of-funnel discovery. It nudges people toward the first touch, not the last click.
- “What brought you to the store today?” Use this for last-touch insight. It is closer to what a pixel records.
- “Who can we thank for your purchase today?” Use this if word of mouth is a big part of the brand.
My default for most Shopify stores is “How did you first hear about us?”. It is the question pixels answer worst.
Build the answer list properly
- 8 to 12 options, no more. AdsX reports lower completion once a list runs past 12.
- Only list channels you actually run or could plausibly be getting. Instagram or Facebook, TikTok, Google search, YouTube or podcast, friend or family, email, and so on.
- Always include “Other (tell us)”. The free-text answers are where the surprises live. Brands often find a Facebook group, a newsletter or a creator they did not know about.
- Randomise the order. Fairing does this by default. If “Instagram” always sits first it will be over-picked.
- Split “Instagram or Facebook” into paid and organic only if you can handle the extra analysis. Otherwise keep it as one option and compare against Meta’s own number.
One detail trips people up. Customers will answer “Google” when they actually saw your ad on Instagram and then searched your brand name. TrueROAS flags this exact pattern. The fix is a follow-up question, covered in the next section, not a longer option list.
Seven Follow-Up Questions Worth Adding Later
Once the attribution question is running and you trust the data, add one conditional second question. Do not stack them. Here are seven worth considering, drawn from Fairing’s list of 24 post-purchase questions and from stores we work with:
- “What almost stopped you from buying today?” The best conversion question you can ask. It surfaces the objection that your product page failed to answer.
- “Who is this purchase for?” Tells you your gift share before BFCM, when it matters most for creative and shipping cut-off messaging.
- “Are you switching from another brand?” Follow with “which one?” to build your real competitor list.
- “What phrase would you Google to find a brand like ours?” Free keyword research, in the customer’s own words.
- “What would you like us to offer more of?” Product development input from people who just spent money with you.
- “Did you see our ads before you bought?” Shown only if they picked Friend or family. Cuts memory bias and tells you how much word of mouth was seeded by paid.
- “What accessories would you want with this?” Tortuga used an accessories question to rationalise its main product lines and add accessories that lifted average order value, according to Fairing.
Use branching. If someone picks “Friend or family”, ask the “did you see our ads” follow-up. If they pick “Other”, the free-text box appears. If they are a returning customer, skip attribution entirely and ask about product or experience instead. Fairing, Grapevine and KnoCommerce all support this.
Enavi, an ecommerce agency quoted in a Fairing roundup of expert questions, reported 12 to 15% higher add-to-cart rates after feeding the answer to “what is the product’s biggest benefit to you?” back into product page short descriptions. That is one agency’s result, not a guarantee, but it shows where the second question pays for itself.
Which Shopify Survey App to Use (Prices and Trade-offs)
Shopify’s native checkout does not include an attribution survey builder, so you need an app. Check current pricing on the Shopify App Store before you commit, since all of these bill in USD and change plans often. As of November 2026:
| App | Pricing (USD) | Good for |
|---|---|---|
| Fairing | Free to 200 orders a month. $49 for 201 to 500, $99 for 501 to 1,000, $149 for 1,001 to 5,000 | Largest user base (3,500+ brands), AI summaries, Klaviyo and Meta integrations |
| Grapevine | $25 a month flat, 14-day trial | Small stores that want unlimited responses and revenue by channel |
| KnoCommerce | $19 Starter, $119 Analyst, $299 Pro | Heavy branching logic and 60+ order attributes to slice results |
| Zigpoll | Free Lite with 100 responses a month. Paid $39 to $259 | Testing the idea before you pay for anything |
Prices are from each vendor’s Shopify listing and Fairing’s app comparison page, which means the comparison leans toward Fairing. Verify before you buy.
Setup in about 10 minutes (Fairing example)
- Install the app from the Shopify App Store and approve the permissions so responses can be tied to orders.
- Open the question stream and click New Question.
- Type “How did you first hear about us?” and add 8 to 12 answer options plus “Other”.
- Turn on answer randomisation and enable the free-text box for “Other”.
- Click Open Preview and place a test order. If a script blocker hides the survey, check the vendor’s support docs.
- Click Enable. The survey now shows on your thank-you page.
- Connect Klaviyo and GA4 if the app offers it, so answers appear as customer properties and can feed segments.
Do you need an app at all? A Typeform or Google Form embedded on the thank-you page technically works, but responses are not linked to orders, so you cannot split by order value, new versus returning, or discount code. That linking is where most of the value lives. Buy the app.
Quick privacy note for Australian stores: survey answers tied to a customer record are personal information. Make sure your privacy policy covers it, and only collect what you will act on.
How to Read the Results Without Fooling Yourself
Run the survey for 30 days. Then build one table: survey share by channel on the left, platform-reported share on the right, and the gap in the middle. This is where the survey earns its keep.
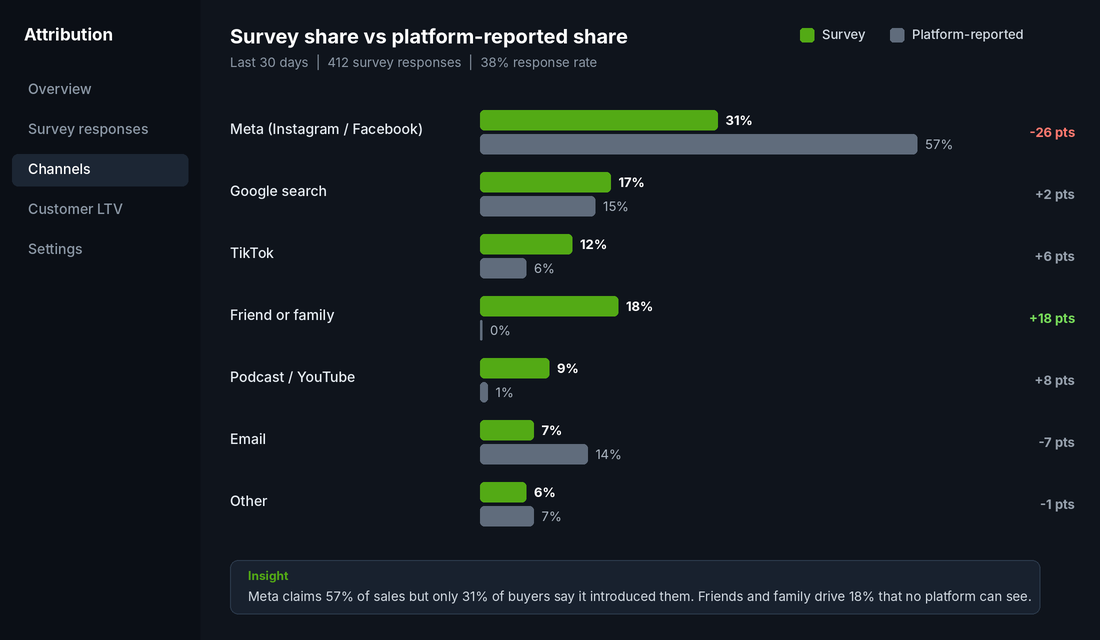
AdsX shares benchmark survey-share ranges for brands doing roughly $500K to $5M a year: Meta 25 to 45%, Google search 12 to 22%, friend or family 10 to 20%, organic search 8 to 16%, TikTok 5 to 15%, email 5 to 12%, influencer 4 to 12%, podcast 2 to 8%, and YouTube 2 to 6%. They are US-leaning, so use them as a sanity check, not a target.
Three reading rules
- A big gap is a question, not a verdict. TrueROAS makes this point well: if 47% say Instagram and tracking says 22%, tracking is probably too low, but that does not mean Instagram deserves 47% of your spend.
- Surveys over-credit what people remember. A TV-style or influencer moment sticks. A retargeting ad does not. That is why you check with a test.
- Pair the survey with an incrementality test on your biggest channel. If Meta survey share sits above 45%, run a holdout before you celebrate or cut. Our guide to Meta ads attribution settings covers the settings, and Meta’s Conversion Lift tool is free in Ads Manager.
A worked example of survey data changing a budget
The Purposeful Profits write-up describes an anonymised supplement brand turning over about 180,000 a month. It spent 60,000 on Meta and 20,000 on Google, with reported ROAS of 3.6x and 4.1x. The survey said 34% of buyers first heard about the brand on TikTok, despite zero TikTok spend. A Meta lift test showed only an 8% lift, which suggested most Meta conversions were people who would have bought anyway. The brand moved 25,000 from Meta into a TikTok creator programme and reported 31% more new customers within 60 days at a lower blended CAC.
That is one consultancy’s own case, so treat the numbers as a story, not a benchmark. The method is what matters: survey finds the mismatch, a test confirms it, then budget moves in a small, reversible step.
Use the “What Almost Stopped You?” Question to Lift Conversion
Attribution gets the attention, but the objection question often pays back faster. It tells you what nearly lost the sale, in words you can paste straight into your product pages.
A fashion or apparel store, for example, might see this when it codes 200 to 300 answers into themes:
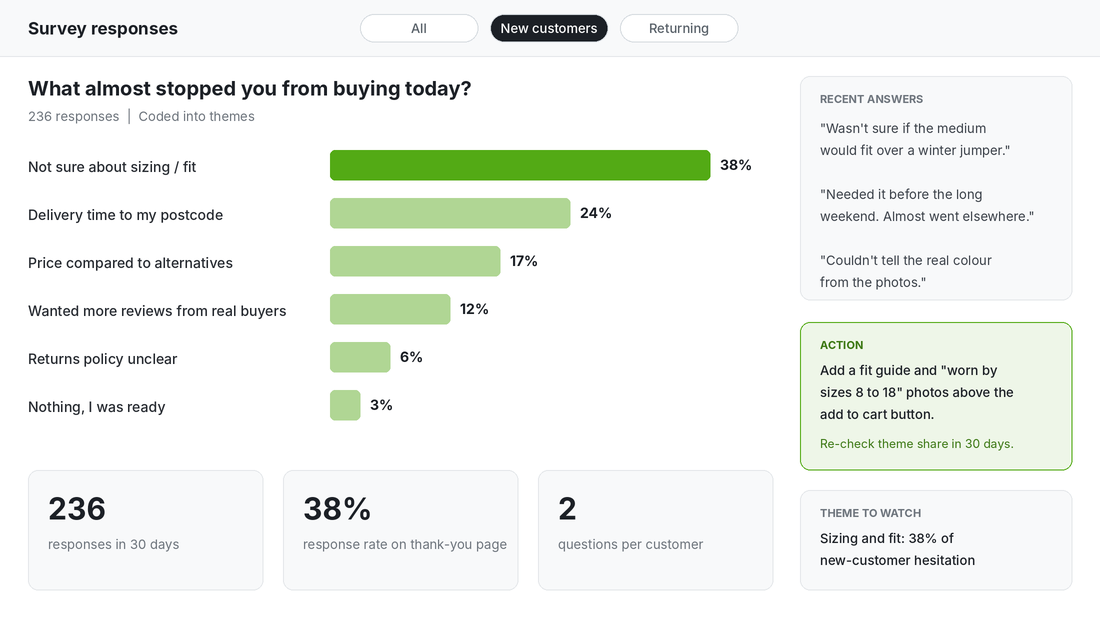
Each theme maps to a fix you can ship this week:
- Sizing and fit: add a fit guide, model height and size, and “worn by sizes 8 to 18” photos above the add to cart button.
- Delivery time to my postcode: show an estimated delivery date on the product page and in the cart. Australia is big, and a Perth customer needs to know it will not take two weeks.
- Price versus alternatives: do not discount yet. Add a comparison or a clear “why it costs more” section, plus the guarantee.
- Wanted more reviews: pull review snippets higher on the page and add photo reviews from real buyers.
- Returns unclear: put a one-line returns promise near the buy button and link the full policy.
One agency-style example in the Holo Growth piece makes the point neatly: a brand assumed price was its top objection, the survey showed shipping time was the real one, and a “ships in 2 business days” badge plus a retargeting ad about fast shipping moved conversion more than any price test had. The assumption was wrong, and without the question nobody would have known.
This is the same logic behind our non-buyer research method: ask the people who nearly did not buy. The survey just does it automatically for every order. If you want to see how your store scores on customer understanding, the Prospects section of the Scorecard checks exactly this.
The Compound Effect: Survey, Test, Fix, Repeat
A single survey answer is a data point. Run it for a quarter and it becomes a system with four loops feeding each other:
- Budget loop. Survey share versus platform share tells you which channels to test cutting or scaling.
- Conversion loop. Objection themes tell you what to change on product pages, the cart and your shipping messaging. Our Shopify CRO audit gives you the audit order.
- Messaging loop. The words customers use in free-text answers go into ad copy, subject lines and headlines. Pair this with customer research for the full picture.
- Retention loop. Send survey answers to Klaviyo as properties. A gift buyer and a self-purchaser should not get the same post-purchase flow.
Each loop is small. Together they stop you making expensive guesses. A store that learns it was underfunding a channel, fixes the top objection, and rewrites its headline with customer language usually sees the gains stack up inside a quarter. The survey itself costs between nothing and a couple of hundred dollars a month.
Your 30-Day Post Purchase Survey Checklist
Copy this and work through it. Most stores can finish week one in an afternoon.
- Day 1: Pick an app. If you are under 200 orders a month, start on a free plan.
- Day 1: Create one question: “How did you first hear about us?” with 8 to 12 options plus “Other”.
- Day 1: Randomise options, place the survey inline on the thank-you page, and run a test order.
- Day 2: Connect Klaviyo and GA4 so answers sync to customers.
- Day 7: Read every “Other” answer. Add the new channels that appear at least 3 times.
- Day 14: Add one branching follow-up, either “did you see our ads?” for word-of-mouth answers or “what almost stopped you?” for everyone.
- Day 30: Build your survey-versus-platform table. Flag any channel with a gap over 10 points.
- Day 30: Pick one channel to test with a holdout or a modest budget shift, and one objection to fix on the product page.
- Day 60: Re-run the table. Compare against Day 30 and keep what moved.
Keep a simple rule: change one thing per loop at a time. If you shift budget and rewrite the product page the same week, you will not know which one worked.
Where to Go From Here
Inside eCommerce Circle, knowing exactly who your customers are and how they found you is one of the core pillars we work on with every member. If you want to see exactly where your store is being capped, take the free More Orders Scorecard. It takes two minutes, it is free, and it shows you which of the 10 P’s to fix first.