A typical median average order value sits around A$100 to A$130 depending on category, with top-quartile stores reaching roughly A$145 to A$170, and the number that matters most is how far yours sits from your own free shipping line. Divide total revenue by number of orders, then compare it to the benchmarks below and to what it costs you to win each customer.
Most founders react to a weak AOV by buying more traffic. That is the expensive way to fix it. Every extra dollar in the basket drops almost straight to contribution margin because the ad click, the packaging run and the pick and pack labour were already paid for.
This guide gives you the Australian benchmarks, the three numbers to calculate before touching your store, seven fixes in the order we run them with members of eCommerce Circle, and a 30-day sprint you can start on Monday. If you have not worked out what a customer costs you yet, start with our customer acquisition cost guide first, because AOV only makes sense next to CAC.
What Average Order Value Is (and the Formula)
Average order value (AOV) is total revenue divided by the number of orders over the same period. If you took A$50,400 across 600 orders last month, your AOV is A$84.
Two details trip people up. First, use net revenue after discounts and refunds, excluding shipping and GST, or you will flatter yourself. Second, pull the number from the same source every time. Shopify analytics, GA4 and Klaviyo all calculate it slightly differently, and a 3% gap between tools will send you chasing a lift that is not real.
- AOV = net product revenue ÷ number of orders
- Units per order (UPO) = units sold ÷ number of orders. It shows whether AOV moves because of basket size or price.
- Contribution AOV = AOV minus product cost, shipping cost, payment fees and packaging. This is the number you actually spend from.
That last one matters because payment fees take a bite out of every order. Our breakdown of Shopify Payments fees in Australia shows how much a A$90 order really keeps.
Average Order Value Benchmarks for Australia
There is no official ABS number for Shopify store AOV, and anyone quoting one is guessing. What exists is vendor data, which we treat as a range rather than a target. Here is what we found when we went looking in November 2026.
| Category | Median AOV (A$) | Top quartile (A$) |
|---|---|---|
| All verticals (global) | about 113 | about 170 |
| Apparel | about 126 | about 168 |
| Beauty | about 99 | about 145 |
| Food and beverage | about 105 | not published |
Source: Eightx Australian AOV benchmark, June 2026. These are global vendor medians converted to Australian dollars, not measured Australian data.
Treat the table as a sanity check. Three reference points help you read it:
- Rule of thumb on price. The same Eightx piece suggests true AOV usually lands at 1.2 to 1.8 times your average product price. If your average item is A$45 and your AOV is A$48, you have a basket problem, not a pricing problem.
- Australian freight premium. Eightx notes local brands often set targets 10% to 20% above the global median to absorb freight. For apparel that points to roughly A$140 to A$168.
- The long-run direction. Oberlo tracks November order values (in pounds) rising from £87.36 in 2020 to £114.25 in 2024, a lift of about 31%. Shoppers are spending more per order, so a flat AOV is quietly a falling AOV in real terms.
Your conversion rate and your AOV multiply together, so benchmark both. Our Shopify conversion rate benchmarks sit alongside these numbers.
Three Numbers to Calculate Before You Change Anything
Skip this section and you will optimise the wrong thing. It takes about an hour with a Shopify order export.
1. Your order value distribution
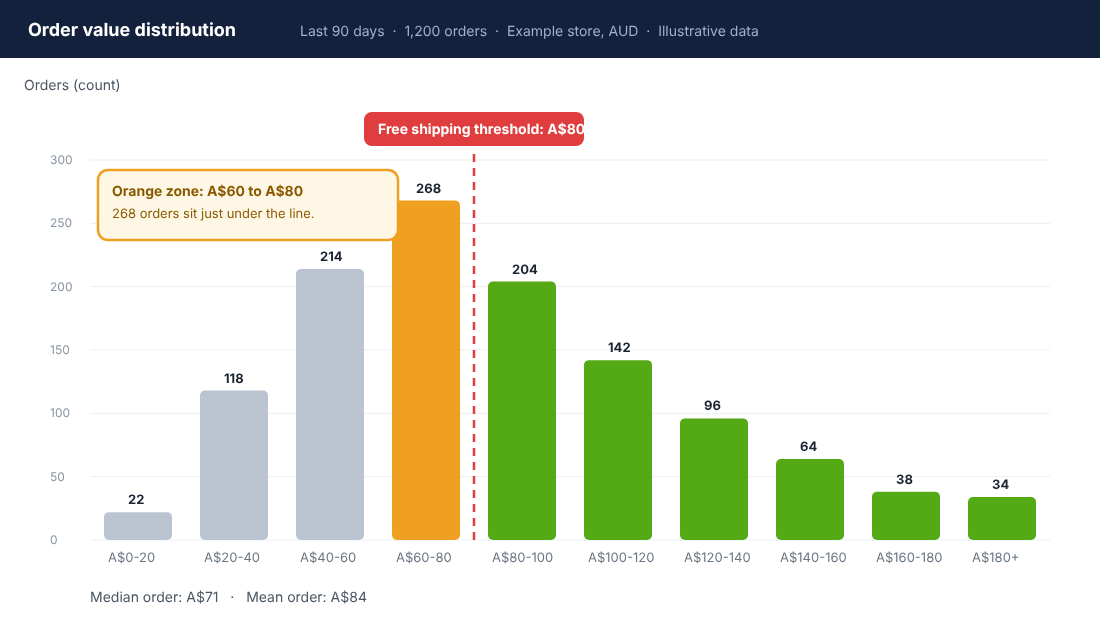
Export 90 days of orders and group them in A$20 bands. The mean hides the shape. A store with a median order of A$71 and a mean of A$84 has a few big orders pulling the average up and a crowd of orders sitting just under your free shipping line.
That crowd is your opportunity. In the example below, 268 of 1,200 orders land between A$60 and A$80, directly under an A$80 threshold. Moving even a quarter of them over the line beats any brand new tactic.
2. Your break-even basket lift
Free shipping is a cost, not a gift. Before you set or move a threshold, work out how much extra basket you need to pay for it.
Break-even lift = shipping you absorb ÷ product margin %. If you absorb A$9.50 of shipping on a product margin of 55%, customers must add A$17.27 to their basket for you to come out even (9.50 ÷ 0.55). A threshold that nudges people up by A$8 loses money on every order it wins.
Our full workings, including how to pick the figure, are in the free shipping threshold guide.
3. Your ceiling from ad spend
Higher AOV lets you pay more for customers. A store that lifts AOV from A$84 to A$92 on 1,200 orders per 90 days adds A$9,600 of revenue. At a 45% contribution margin that is A$4,320 of extra profit with no new traffic. It also lifts the ROAS you can afford, which you can check with our break even ROAS formula.
7 Ways to Lift Average Order Value on Shopify
We run these in order. The first three are structural changes that work on every order. The last four are offers that depend on the customer and the product.
1. Set the free shipping threshold from your data
Pick a line roughly 20% to 30% above your current median order, then check it against the break-even lift above. In the distribution example, the median is A$71, so A$80 to A$90 is the zone to test.
Evidence supports the move. A FedEx and Morning Consult study of 2,103 US consumers, published October 2024, found 81% of shoppers are willing to increase their spend to meet a retailer’s free shipping threshold. It also found 75% prioritise free shipping over fast shipping. That is American data, so expect the same direction but test the size locally.
Real example: Frank Green runs a free shipping line at A$75 and shows it in both the site banner (“Free Shipping on orders $75+”) and the cart drawer (“Spend $75 more for FREE shipping”). We checked the live site on 6 November 2026. Showing the line in two places is the important part.
2. Show the gap in the cart, not just the banner
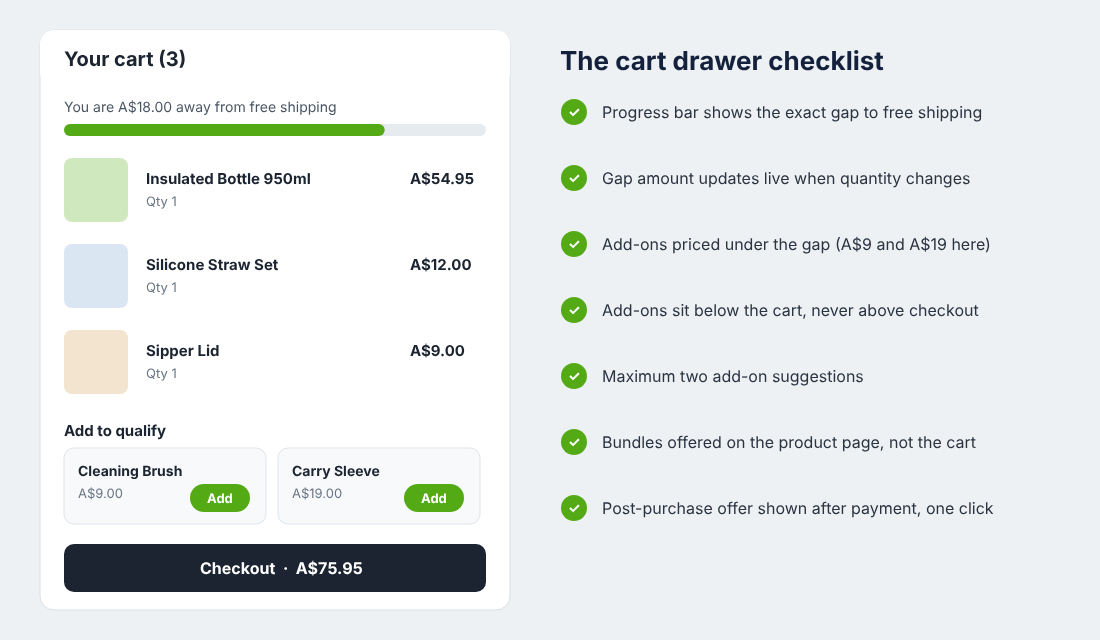
A banner is a promise. A progress bar is a prompt. When the cart reads “You are A$18.00 away from free shipping,” the customer has a specific task and a visible way to finish it.
Baymard’s review of 50 studies puts average cart abandonment at 70.22%, and 40% of US shoppers who left cited extra costs such as shipping, tax and fees. Another 12% could not see the total cost up front. A live gap message answers both complaints at once.
- Update the gap live when quantity changes
- Show it in the cart drawer and on the cart page
- Make the message plain: an amount, not a percentage
3. Offer add-ons priced under the gap
The add-on has to fit the gap. If the customer is A$18 short, offering a A$60 item feels like a sales pitch. Offering a A$9 cleaning brush or a A$19 carry sleeve feels like help.
Pick two add-ons per product family: a consumable and an accessory. Keep them under 25% of the product price. Show a maximum of two, since more choices slow the checkout.
4. Build bundles that make sense together
Bundles lift AOV because the customer buys three things they already wanted instead of one. We cover pricing maths in our Shopify product bundles guide, so here is the short version: discount the bundle by 8% to 15%, never more, and bundle by use case rather than by whatever needs clearing.
Real example: Go-To Skincare sells ready-made sets at a spread of price points, which we recorded on 6 November 2026: Nifty Gifty (an SPF duo) at A$75, Heroes Only at A$100, The Luxe List at A$150 and Twelve Days of Go-To at A$175. Each set sits near or above a typical free shipping line, which shapes what a gift buyer puts in the cart. The store did not show a “frequently bought together” block when we looked, so it leans on sets alone.
5. Add a post-purchase offer
The offer appears after payment and before the thank-you page. The customer has already decided to buy, so one tap adds an item with no re-entering of card details.
CartHook case studies published by Shopify give a sense of the upside: 310 Nutrition had 30% of customers accept an upsell and saw AOV rise 25%. Those figures are vendor-reported and dated, so treat them as a ceiling and measure your own acceptance rate on a first test.
Check the limits before you build. Shopify’s developer documentation says a customer can accept up to three offers per checkout, but offers are not shown when the order is paid with an installment or wallet service. In Australia that matters because Afterpay and Apple Pay buyers will not see your offer. Check the share of orders paid that way before you forecast a number.
6. Use quantity breaks on consumables
If your product runs out, sell a bigger pack. Tiered pricing on a two-pack or three-pack (for example 5% off two, 10% off three) lifts units per order, and it feeds your repeat rate because the customer reorders less often but never runs out.
Watch the second order. A larger first basket can delay the repeat purchase, so track both numbers using our repeat customer rate benchmarks.
7. Run a gift with purchase tier, sparingly
“Free sample over A$120” can work, but it is also the easiest tactic to overuse. Run it for a defined window such as the lead-up to Black Friday, cap it, and make the gift cheap to you and visible to them. Our guide to running a VIP early access sale shows how to stage this: Black Friday early access.
The Tool to Start With: Shopify Bundles (Free)
If you only install one thing this month, make it Shopify’s own Bundles app. It is built by Shopify, listed as free on the App Store, and lets you create fixed bundles and multipacks from your admin with no code. Inventory updates in real time, which prevents overselling a bundle component.
Setup, in general terms (menu labels change between releases, so follow the on-screen prompts):
- Install Bundles from the Shopify App Store and open it from your admin.
- Create a new bundle and add the products and quantities it contains.
- Set the bundle title, images and the discounted price.
- Publish it to your Online Store and test it in a real cart.
- Add the bundle to the product page and a collection of its own.
Know the limits. Reviewers (2.9 out of 5 across 571 reviews at the time we checked) report that custom variants inside a bundle are awkward and that option limits arrive quickly when each product has several sizes or colours. If your range is variant-heavy, test with a simple multipack first.
Shopify’s help centre also notes you need a bundles app installed before you can create bundles, and that bundles can be sold through the Online Store, Shop and Shopify POS. Pair it with a post-purchase app for step 5, and check which plan the app asks for before you commit.
The Compound Effect: How the Fixes Stack
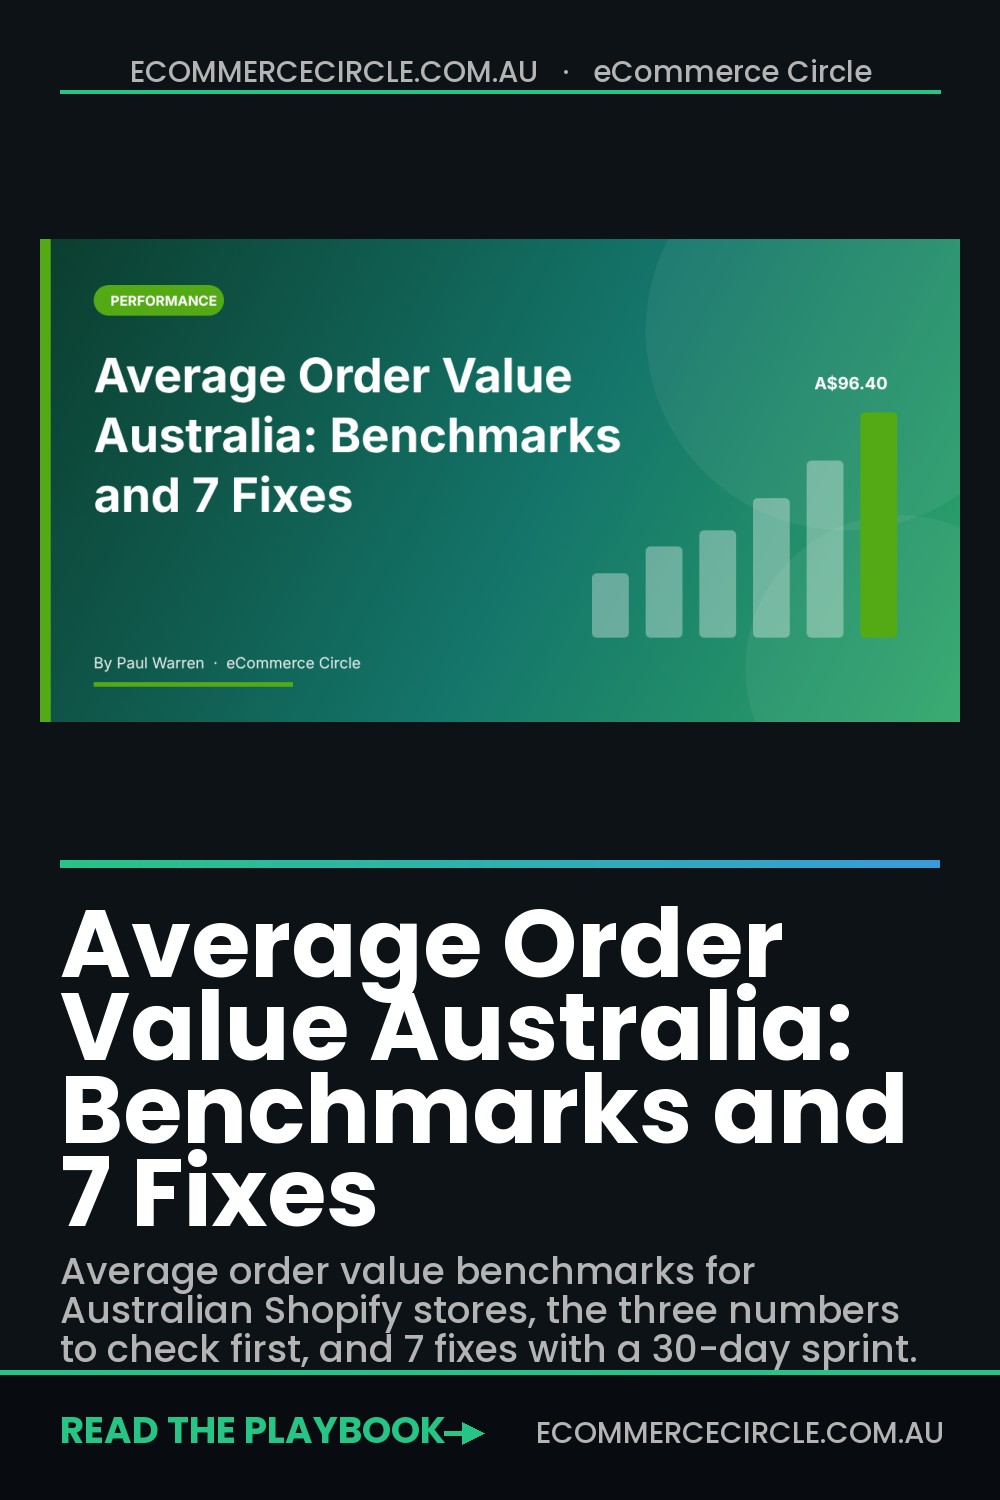
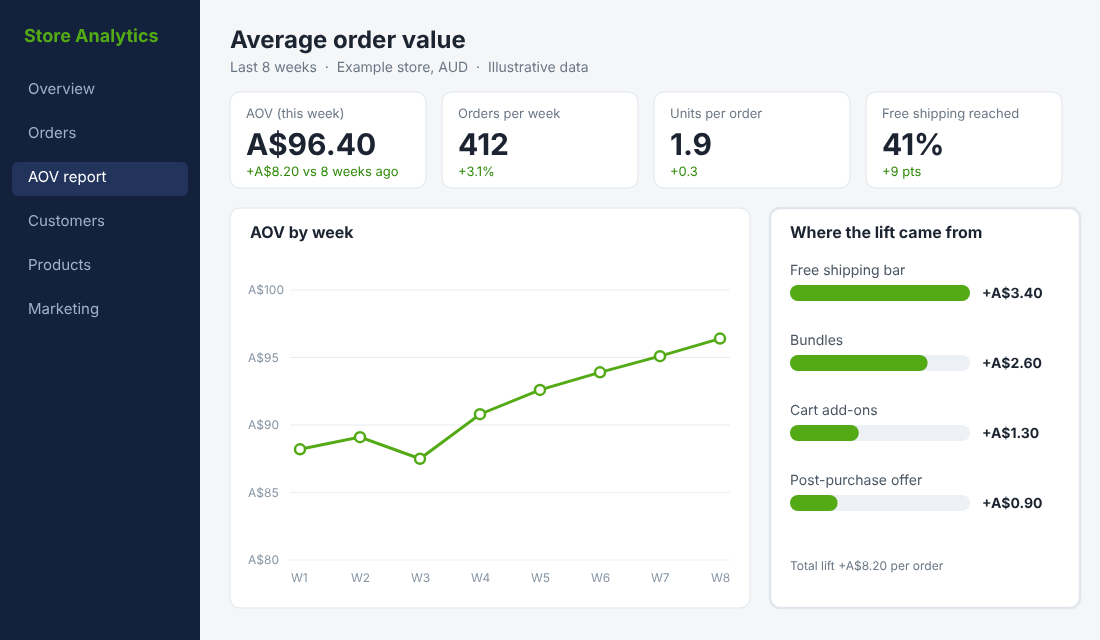
No single tactic moves AOV by a huge amount. A free shipping bar might add A$3 to A$4. A bundle adds a couple more. An add-on and a post-purchase offer add the rest. In the dashboard example, four tactics together moved AOV from A$88.20 to A$96.40 over eight weeks, a rise of A$8.20 or about 9%.
That is the real shape of the win: small, additive gains that each pay for themselves, rather than a single “hack.” It is also why we measure each one separately. If you switch everything on at once you will not know which change did the work, and you will not know which to remove when margin gets tight.
The order matters too. The threshold sets the target. The progress bar shows it. Add-ons and bundles help people reach it. Post-purchase picks up whatever is left. Each step makes the next one work harder.
Your 30-Day AOV Sprint (Template)
Copy this into your project tool and work through it. We run the same rhythm with members.
| Week | Job | Done when |
|---|---|---|
| 1 | Export 90 days of orders. Calculate AOV, UPO, median and the distribution chart. Work out your break-even lift. | You have one baseline number and a chart |
| 2 | Set or move the free shipping threshold. Add the cart progress bar. | Threshold is above median and passes break-even |
| 3 | Add two add-ons under the gap. Launch one bundle on your best seller. | Both live and tested on mobile |
| 4 | Switch on a post-purchase offer. Compare AOV to the baseline week. | Each tactic has its own result logged |
Rules for the sprint:
- Change one thing per week so you can attribute the result
- Compare like weeks (not Black Friday week against a quiet one)
- Track conversion rate alongside AOV, because an AOV gain that costs you 10% of orders is a loss
- Check contribution AOV monthly, not only revenue AOV
Common Mistakes That Cancel the Gain
- Threshold below the break-even lift. You raise AOV and lose margin on every order that crosses the line.
- Too many offers. A cart with six upsells looks like an ad network. Cap it at two.
- Discounting the bundle too deep. A 25% bundle discount trains customers to wait for it.
- Measuring AOV in isolation. Check conversion rate and returns next to it. If you want a full diagnosis, our CRO audit checklist covers the checkout side.
- Testing during a peak. A sale week makes every tactic look good or bad for the wrong reason.
Where to Go Next
AOV is one of the ten numbers that decide whether a store grows or stalls. It sits in the Performance pillar of the More Orders Operating System, next to conversion rate and CAC, and it only pays off when the rest of the system holds up.
Inside eCommerce Circle, AOV is one of the core levers we work on with every member. If you want to see exactly where your store is being capped, take the free More Orders Scorecard. It takes two minutes and shows you which of the 10 P’s to fix first.