Your break-even ROAS is 1 divided by your contribution margin, and it is almost always higher than you think. For a typical $89 Aussie Shopify product with a 75% gross margin, the real break-even is 2.19x, not the 1.33x most calculators give you.
That gap is where ad accounts quietly bleed. A store runs Meta ads at 1.8x, the dashboard looks fine, the founder tells themselves “we’re above 1”, and every order loses money once GST, shipping, pick and pack, payment fees and returns come out. Revenue climbs. The bank balance doesn’t.
This guide gives you the exact formula, a worked Australian example with real numbers, a sheet you can copy today, and the rules we use inside eCommerce Circle to decide which campaigns to scale, hold or kill. If you run ads at all, you need this number before Black Friday on 27 November.
What break-even ROAS actually means
ROAS (return on ad spend) is revenue from ads divided by ad spend. If you spend $1,000 and Meta reports $2,500 in purchase value, your ROAS is 2.5x.
Break-even ROAS is the ROAS at which that ad spend exactly covers the cost of fulfilling the orders it produced. Below it, you lose money on each sale. Above it, you make a contribution toward overheads and profit. It is the floor, not the target.
Shopify’s own guide gives the base formula: gross profit margin is (revenue minus variable costs) divided by revenue, and break-even ROAS is 1 divided by that margin. Their example is a $100 product with $60 of variable costs. That is a 40% margin, so break-even ROAS is 1 / 0.40 = 2.5x.
Two things matter in that formula. First, “variable costs” means everything that moves with each order, not only the cost of the product. Second, the margin has to be calculated on the same revenue Meta is reporting, and in Australia that is where most stores get it wrong.
The Aussie mistake: ignoring GST
Your Shopify prices in Australia include 10% GST. Meta reports the purchase value your customers paid, GST and all. But that GST is not your money. It goes to the ATO.
On an $89 product, $8.09 is GST. Your real revenue is $80.91. If you calculate margin on $89, you overstate it by about 10%, and your break-even ROAS comes out too low.
This is the first fix: work out your margin on ex-GST revenue, then divide the GST-inclusive price by your per-order contribution. The sheet below does exactly that.
Online spend in Australia hit a record $82.6 billion last year, around 24% of all retail, with 9.8 million households (about 82%) shopping online, according to Australia Post’s eCommerce research. The market is big enough that competition for the same Meta audiences keeps rising, which is why the stores that survive are the ones who know their floor to the cent. Our Meta ads CPM guide for Australia shows what that competition costs you in November.
The five-line break-even sheet (copy this)
Here is the template. Build it in a Google Sheet, one tab per hero product, and every number flows from five inputs.
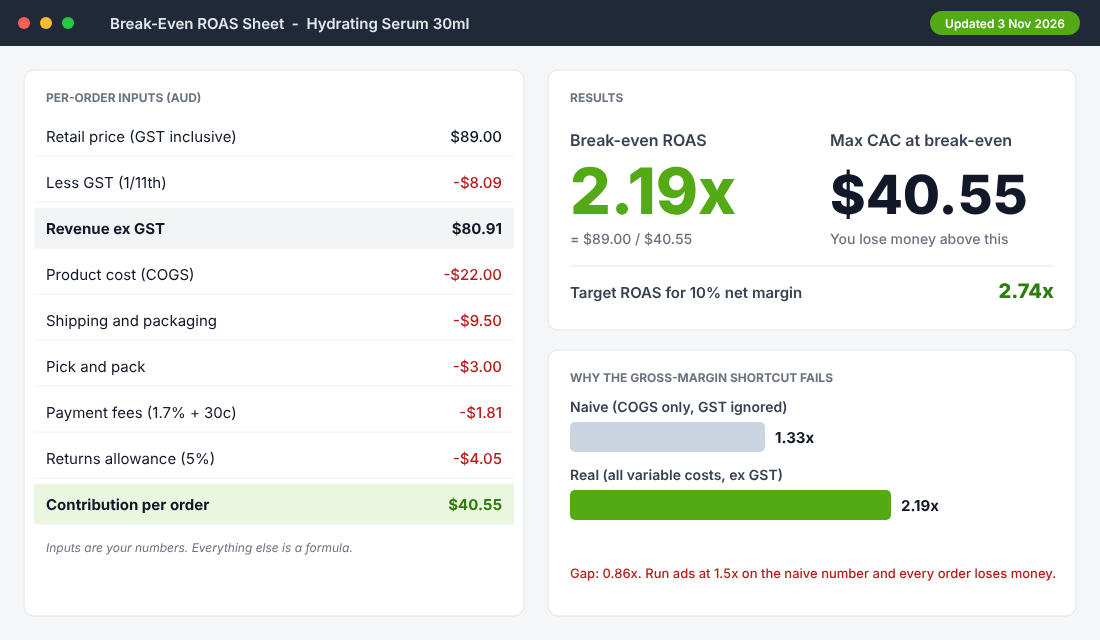
Here is the worked example. A hydrating serum retails at $89 including GST:
- Revenue ex GST: $89 / 1.1 = $80.91
- Product cost (COGS): $22.00
- Shipping and packaging: $9.50
- Pick and pack (your time, a 3PL or a VA): $3.00
- Payment fees: 1.7% of $89 plus 30c = $1.81 (check your own plan, see our Shopify Payments fees guide)
- Returns allowance: 5% of ex-GST revenue = $4.05
Total variable costs come to $40.36. Contribution per order is $80.91 minus $40.36 = $40.55.
Now the two numbers that run your ad account:
- Break-even ROAS = price paid / contribution = $89 / $40.55 = 2.19x
- Maximum CAC at break-even = $40.55. Pay more than that to acquire a customer on a first order and you lose money.
Compare that with the shortcut most blogs teach: gross margin on COGS alone is ($89 minus $22) / $89 = 75%, which gives a break-even ROAS of 1.33x. Run ads at 1.5x on that belief and you feel profitable while losing about $9 an order. That 0.86x gap is the whole story.
How to set a target ROAS (not just a floor)
Break-even keeps you alive. A target ROAS keeps you in business. Decide what net contribution you want after ad costs, usually 10 to 20% of ex-GST revenue while you are scaling.
For a 10% target on the serum: 10% of $80.91 is $8.09. Your allowable CAC is $40.55 minus $8.09 = $32.46. Target ROAS is $89 / $32.46 = 2.74x.
So the serum has three numbers: kill below 2.19x, hold between 2.19x and 2.74x, scale above 2.74x. Write them on a sticky note next to your monitor.
Why your gross margin is hiding the real picture
Founders tend to track gross margin because Shopify, Xero and their accountant all show it. It answers a different question: “Did the product make money?” It does not answer “Did the order make money after I paid to get it?”
The costs that matter for ROAS live between gross margin and net profit:
- Shipping and packaging. Postage and courier charges are a real cost on every parcel. If you offer free shipping over a threshold, the cost sits on your side of the order. Our free shipping threshold guide covers how to set it without killing your margin.
- Pick, pack and packaging labour. A VA, a 3PL, or your own Saturday mornings. Even $3 an order matters when you ship 2,000 a month.
- Payment processing. A percentage plus a fixed fee on every order, including the GST portion. If you offer Afterpay, the fees are higher again.
- Returns. Australia Post’s 2026 eCommerce Report found that 41% of online shoppers returned at least one item in 2025. That is a share of customers, not orders, but it tells you returns are normal. Fashion is the heavy end: an Eightx review of Power Retail’s Switched On 2026 data puts fashion and apparel returns at roughly 31%, and flags that figure as directional because the full report is paywalled.
- Discounts. Every code or markdown shrinks the revenue side while your costs stay put.
Cettire, the ASX-listed luxury retailer, is a useful reminder of how fast variable costs move margin. Eightx’s read of its accounts shows delivered margin falling from 20.9% in FY24 to 16.1% in FY25. When a business that size sees five points disappear, the ad account has to move with it. The target ROAS you set last year is no longer your target.
If you are not sure what your returns rate actually is, start with your own data. Our returns policy guide for Australian stores explains what you can and cannot refuse, which sets your realistic allowance.
What good ROAS looks like (and why benchmarks mislead)
Every founder asks, “What is a good ROAS?” The honest answer is that it is a good ROAS only if it clears your break-even.
Lebesgue’s Meta Ads Benchmarks (published 7 September 2026) report median ROAS across eight ecommerce industries and four order-value bands. The spread is wide: the lowest median is 1.59x (Services and Other, under $50) and the highest is 4.58x (Home and Lifestyle, $200 and over).
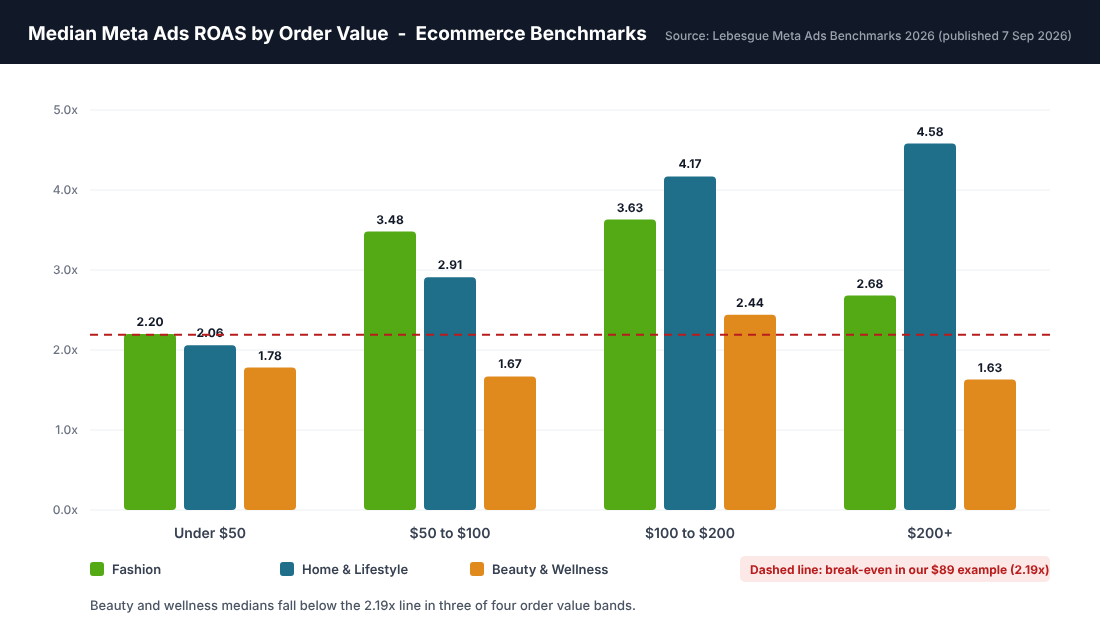
Read that chart against the 2.19x line from our example:
- Fashion medians clear 2.19x in every band, peaking at 3.63x for $100 to $200 orders.
- Home and Lifestyle is strongest at higher order values, 4.17x and 4.58x for $100 to $200 and $200+ baskets.
- Beauty and Wellness medians are 1.78x, 1.67x, 2.44x and 1.63x. In three of four bands the typical beauty store would sit below our example’s break-even line.
That does not mean beauty brands can’t advertise. It means they need a lower break-even (better margins, a higher AOV through bundles) or a longer payback window built on repeat purchase. Our Meta ads ROAS benchmark for Australia goes deeper on local numbers.
Industry medians are a sanity check, never a target. Your target comes from your sheet.
What the brands that scaled did differently
Shopify’s break-even ROAS guide includes a few operator quotes that show how thinking shifts as a brand grows.
Naadam’s Matt Scanlan recalled how easy early paid social was: “You could put a dollar or two to work in Facebook and Google, and you could get out eight to 16.” Nobody needs a break-even sheet at 8x to 16x. The sheet becomes essential the moment returns shrink toward break-even, which is where most stores end up as competition for the same audiences builds.
Dan Demsky of Unbound Merino said his business maintained “a ROAS of more than three” while significantly increasing reach. That is a deliberate position: a target well above break-even, held as volume grows, rather than chasing spend for its own sake.
AJF Growth’s Andrew Faris is quoted in the same guide saying “most resilient brands target a margin of more than 60%.” Margin is the lever that decides how much ROAS you can afford. A brand at 60% margin has a break-even near 1.7x before the extra costs. A brand at 30% needs over 3.3x.
The lesson for your store: the winners did not find a magic campaign. They knew their floor and refused to trade below it.
First order versus lifetime value
Here is where smart operators change the maths. A first-order break-even of 2.19x assumes you only ever sell to the customer once. If 30% of your customers buy again within 90 days at a similar contribution, your effective first-order cost can be higher.
Do not guess this. Use your actual repeat rate. Our repeat customer rate benchmarks show how to calculate it from your Shopify data.
A safe approach is to run two break-evens:
- Cash break-even (first order only). The floor above. Use it to decide when to pause a campaign.
- Payback break-even (90-day). First-order contribution plus the repeat contribution you reliably see within 90 days. Use it to decide how hard to scale a proven campaign.
Run ads below your cash break-even for more than a few weeks and you need cash reserves to survive it. If you do not have a buffer, stay on the cash floor. Scaling on lifetime value you have not yet collected is how a good brand runs out of cash in a quarter.
Black Friday changes your break-even overnight
Discounts reduce revenue without reducing most of your costs. Take the serum at 20% off:
- Price drops from $89 to $71.20
- Ex-GST revenue drops to $64.73
- COGS, shipping and pick and pack stay at $22.00, $9.50 and $3.00
- Contribution drops from $40.55 to $25.48
- Break-even ROAS rises from 2.19x to 2.79x
At 15% off it is 2.59x. So a campaign that was comfortably profitable at 2.4x in October loses money in your Black Friday week, with the same creative and the same audience. Meta’s attribution and rising CPMs in November usually push ROAS down at exactly the time your break-even goes up.
Before the sale, rebuild your sheet at the discounted price and set your campaign thresholds from that. Our Black Friday discount calculator does the margin side for you. Then set separate rules for the sale window, which brings us to the decision framework.
The ROAS decision ladder: kill, hold, scale
Here is the framework. Fill in the numbers once per product (or per product group with similar margins), then check it weekly.
| Zone | Where ROAS sits | Action |
|---|---|---|
| Red | Below break-even (2.19x in our example) | Pause after 7 days and spend of one max CAC ($40.55), unless purchases are trending up |
| Amber | Break-even to target (2.19x to 2.74x) | Hold budget. Test new creative. Do not scale |
| Green | Above target (2.74x+) | Increase budget by 20% every 3 to 4 days while it holds |
| Gold | Above target by 40%+ (3.8x+) | Cap retargeting budget. Find out why prospecting isn’t matching it |
Why 20% increases? Large budget jumps tend to push Meta back into learning. Small steps protect delivery while you test whether the margin holds at higher spend. Our Meta ads budget guide covers the budget side in detail.
The retargeting caveat matters. Retargeting campaigns often show ROAS of 4x or higher because they harvest people who already know you. That number looks great on a report, but the sales would often have happened anyway. Judge your ad account on blended performance (total revenue divided by total ad spend across the store) as well as campaign-level ROAS. If blended ROAS sits below your break-even while retargeting looks brilliant, your prospecting is losing money and retargeting is hiding it.
Set it up in Meta Ads Manager (10 minutes)
You do not need a paid tool to run this. Triple Whale is one of the paid attribution dashboards that tracks profit alongside ad performance, and it is worth a look once your ad spend and product range outgrow a spreadsheet. Until then, Ads Manager plus your sheet does the job.
Here is the setup:
- Build the sheet. Copy the five-line layout above into Google Sheets. Enter price, COGS, shipping, pick and pack, payment fee percentage, fixed fee and returns allowance. Add formulas for ex-GST revenue, contribution, break-even ROAS and target ROAS.
- Open Ads Manager. Go to Campaigns and click the Columns dropdown, then Customise columns.
- Add the right columns. Tick Amount spent, Purchases, Purchase ROAS (return on ad spend), Cost per purchase and Purchases conversion value.
- Save the preset. Name it “Break-even view” so you can load it in one click every week.
- Add your floor. Export the table, or copy it into your sheet, and add a column for your break-even and target ROAS beside each campaign. Colour cells red, amber or green by the ladder above.
- Set a weekly rule. Every Monday, check the last 7 days. Anything red gets paused, anything green gets a 20% bump. Write down what you changed.
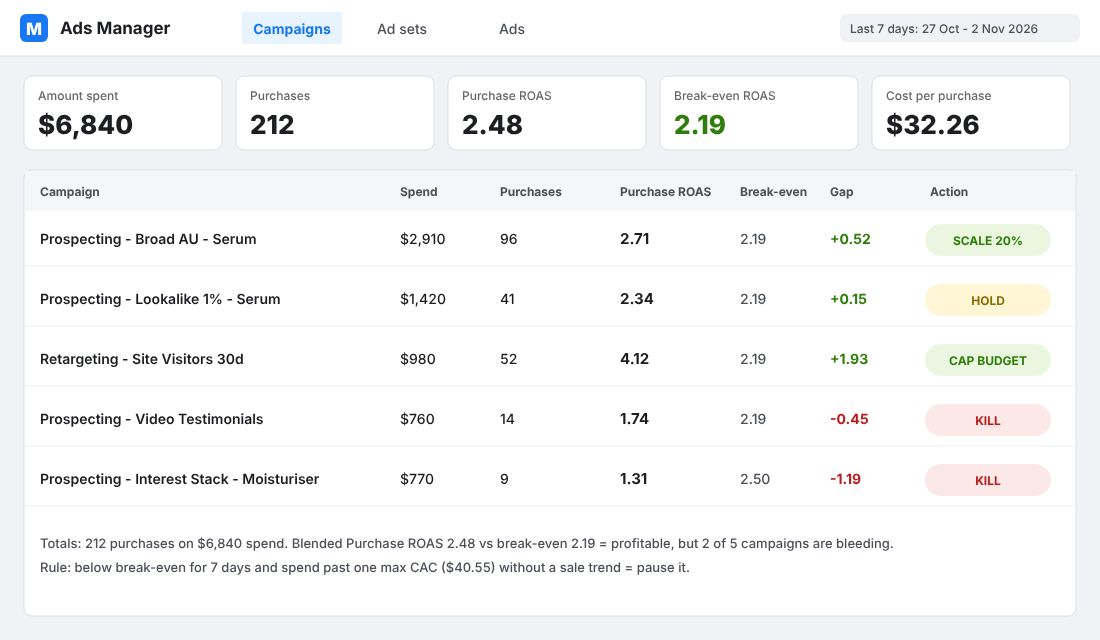
The result looks like the screenshot above: seven days, five campaigns, one blended ROAS of 2.48x against a 2.19x floor. On paper the account is profitable. Look closer and two campaigns burned $1,530 below break-even while the retargeting campaign made the headline number look better than it is.
Check your attribution window too. Meta’s default can credit sales to ads that did not drive them. Our guide on Meta ads attribution settings covers 7-day click versus 1-day, and why it changes your ROAS before you change anything else.
Common mistakes that wreck the maths
Using one break-even for every product. A $29 accessory and a $189 hero product have different margins and different shipping costs. Run the sheet per product or per margin tier.
Forgetting the creative and tool costs. Agency fees, UGC creators, Klaviyo, apps and Meta creative production are overhead, not variable costs, so they do not sit in break-even ROAS. They do sit in your net profit. Cover them with a target ROAS above break-even, as in the 10% to 20% margin we added.
Mixing GST bases. Revenue ex GST against costs that include GST on supplier invoices (if you are GST registered, you can claim GST credits on many costs). Pick one basis and keep the sheet consistent. Your accountant can confirm the right treatment for your structure.
Trusting a 24-hour window. Meta reports shift as conversions are attributed. Judge on 7 days, not 1 day, unless spend is huge.
Ignoring AOV movements. A bundle that lifts AOV from $89 to $119 can drop your break-even sharply because shipping and pick and pack stay flat. See our Shopify product bundles guide for how to price them.
The compound effect: one number connects your whole store
Break-even ROAS is not only an ad metric. It connects four parts of the business at once.
Your margin (supplier negotiation, pricing) sets the floor. Your AOV (bundles, free shipping threshold) lowers it. Your returns rate (product quality, sizing information, policy) raises it. And your repeat rate (email, loyalty, subscription) lets you pay more for a first order without losing cash.
Move any one of these by a few points and your break-even shifts. Improve all four and the same ad account that struggled at 2.5x runs profitably at 1.8x, with room to scale. That is how steady growers work: not by finding a better ad, but by lowering the number the ad has to beat.
This is also where the Profit section of the More Orders Scorecard checks your thinking: whether you know your contribution per order, or only your gross margin.
Your next 30 minutes
- Pick your top-selling product and fill in the five-line sheet.
- Write down your break-even ROAS and your target ROAS.
- Open Ads Manager, load the columns above and compare every active campaign to your floor.
- Pause anything that has been red for 7 days and has spent more than one max CAC.
- Rebuild the sheet at your planned Black Friday discount and set that week’s thresholds before 27 November.
Inside eCommerce Circle, break-even maths is one of the core profit habits we work on with every member. If you want to see exactly where your store is being capped, take the free More Orders Scorecard. It takes two minutes and shows you which of the 10 P’s to fix first.