Here is a conversation that plays out in Shopify stores across Australia every single week. Meta says your ads returned a 4.2 ROAS. Google says 3.8. TikTok is claiming 5.1. You add it all up, feel pretty good about yourself, then open your bank account and wonder where the money actually went.
What’s in This Article
The maths never reconciles because every ad platform is graded by its own referee. Each one claims credit for the same sale, so the numbers on your dashboards are inflated, double-counted, and quietly lying to you. Since iOS 14.5 wrecked third-party tracking, it has only gotten worse. On average, around 20 of every 100 orders never even show up in Google Analytics, and a 10 to 20% discrepancy is now considered normal for a basic setup.
So if you cannot trust platform ROAS, what do you steer by? One number that no algorithm can fudge: your Marketing Efficiency Ratio. MER is the metric serious operators use to know, with certainty, whether their marketing is actually growing the business or just spinning the wheels. Let’s break it down.
What MER Actually Measures (And Why Platform ROAS Lies)
Marketing Efficiency Ratio is gloriously simple. You take your total revenue for a period and divide it by your total marketing spend across every channel. That’s it.
MER = Total Revenue / Total Marketing Spend. If you did $200,000 in sales last month and spent $50,000 across Meta, Google, TikTok, email, and influencers, your MER is 4.0. For every dollar you put into marketing, four dollars came back through the front door. The median MER across Triple Whale’s brands in 2025 sat at roughly 2.4, so a 4.0 is genuinely strong.
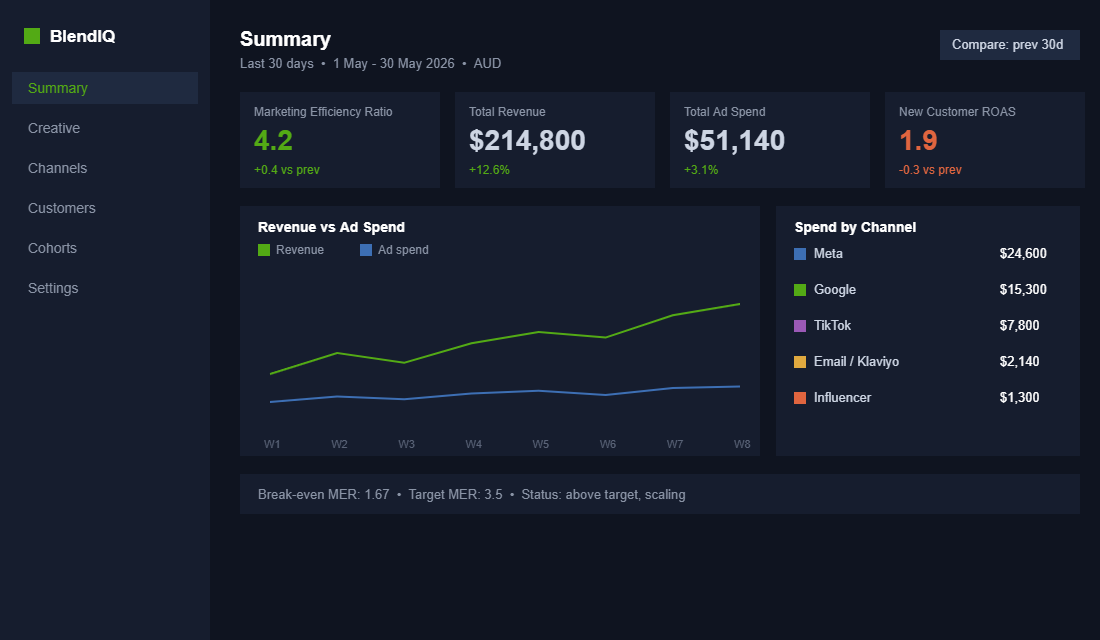
The reason this beats platform ROAS is that it sidesteps attribution entirely. It does not care which ad got the last click or whether someone saw your Meta ad, Googled you three days later, and bought from an email. Every dollar of spend and every dollar of revenue is counted once, against your real bank balance. There is no referee with a conflict of interest. Platform ROAS answers “did this channel work?” badly. MER answers “did my marketing work?” honestly.
The Number Most Founders Skip: Your Break-Even MER
Before you can judge whether a MER of 4.0 is good, you need to know your break-even point. This is where most founders go wrong. They chase a generic “good” number off a blog instead of working out what their own margins demand. A 3.0 MER with a 70% margin leaves plenty of room. The same 3.0 on a 40% margin can mean you are losing money after fixed costs.
Your break-even MER is calculated from your contribution margin, which is your selling price minus all variable costs: COGS, shipping, payment fees, and fulfilment. The formula is Break-even MER = 1 / contribution margin.
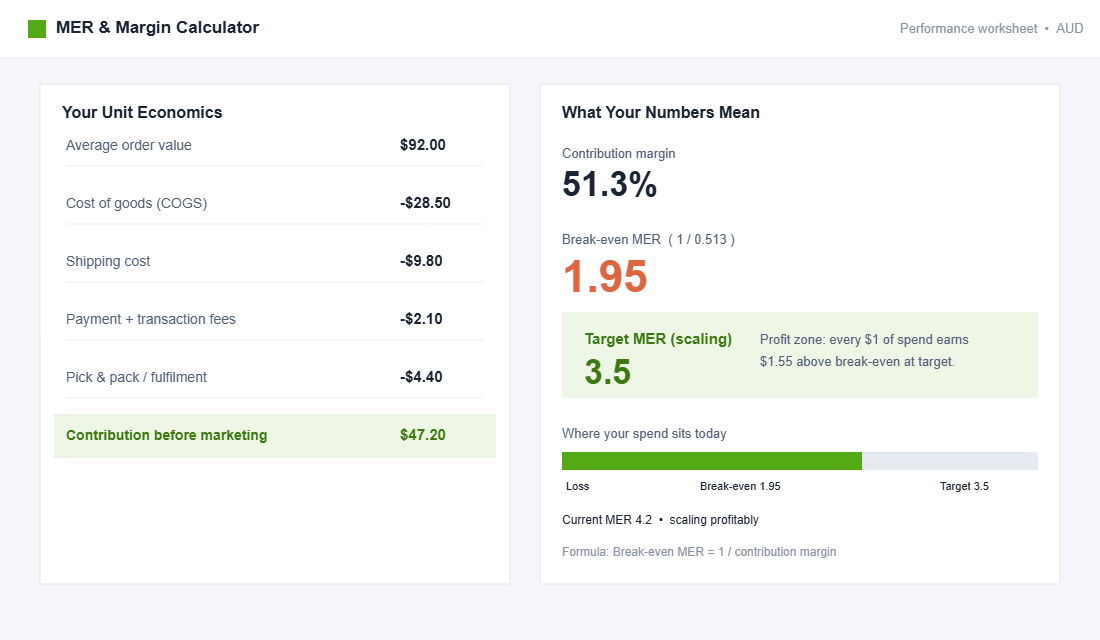
Say your contribution margin before marketing sits at 60%. Your break-even MER is 1 divided by 0.60, which equals 1.67. That means you need at least $1.67 in revenue for every $1 of marketing spend just to stand still. Anything above 1.67 is profit. Anything below it, and you are paying customers to take your product. Most healthy DTC brands aim to keep 30 to 40% contribution margin after marketing is paid for, which is the cushion that funds your team, your rent, and your growth.
- Work out your true contribution margin first. Include shipping and payment fees, not just COGS. Aussie founders routinely forget the 1.7% plus 30c that Shopify Payments quietly skims off every order.
- Calculate your break-even MER. This is your floor. You should know it to one decimal place.
- Set your target MER above the floor. The gap between break-even and target is where your profit lives.
MER vs ROAS: You Actually Need Both
This is not a case of ditching ROAS forever. The two metrics answer different questions, and good operators read them together.
Think of MER as the altitude reading for the whole business and platform ROAS as the diagnostic for an individual channel. MER tells you if the plane is gaining height. Platform ROAS, used carefully and with a pinch of salt, helps you spot which engine is sputtering. If your MER drops from 4.0 to 2.8 over a fortnight, MER tells you something broke. You then drop into your channel ROAS, your creative, and your attribution model to find the culprit.
The mistake is making spend decisions off platform ROAS alone. Meta will happily tell you to pour more budget into a campaign that is cannibalising sales you would have made anyway. MER catches that, because if the extra spend is not lifting total revenue, your ratio falls and the truth is exposed within days. One analysis across 150 DTC brands found those growing 30% or more year on year ran a median blended ROAS of 3.8, while the brands that had stalled were sitting at 2.1.
Setting Your Target MER by Growth Stage
There is no single correct MER, and anyone who tells you there is has not run a store. The right target depends on your stage, your margins, and how aggressively you want to grow.
- Testing or launch phase: MER of 2.0 to 3.0. You are buying data and market share. Lower efficiency is acceptable while you learn what converts.
- Scaling phase: MER of 3.0 to 4.0. You have proven demand and are pushing volume. This is the most common target band for brands between $40k and $200k a month.
- Maturity or profit-focus phase: MER of 4.0 to 5.0+. You are optimising for cash, not growth. Spend gets tighter and every channel earns its place.
A brand sprinting for the top line might happily run a MER of 2.5 to grab customers before a competitor does, betting on repeat purchases to make the economics work later. A founder who wants to pay themselves this quarter runs at 4.5. Both can be right. What is never right is not knowing which game you are playing.
How to Track MER Without a Data Team
You can track MER in a spreadsheet on day one, and honestly you should before you pay for anything. Pull total revenue from Shopify, total spend from each ad platform, add them up, divide. Five minutes once a week beats a fancy dashboard you never open.
When the spend gets large enough that manual tracking becomes a chore, a purpose-built tool earns its keep. Triple Whale is the most popular choice for Aussie DTC brands because it consolidates Shopify, Meta, Google, and TikTok into one view and calculates blended metrics automatically, often fully instrumented in under an hour. Here is the setup:
- Install the Triple Pixel and connect Shopify via the Triple Whale app from the Shopify App Store. This pulls in real revenue, orders, and customer data.
- Connect your ad accounts (Meta, Google, TikTok) through their OAuth integrations so spend flows in automatically.
- Add your cost data. Enter COGS, shipping, and fees so the platform can show contribution margin alongside MER, not just top-line ratios.
- Pin MER to your Summary dashboard. It sits front and centre next to platform ROAS and new customer metrics, so the honest number and the flattering numbers are side by side.
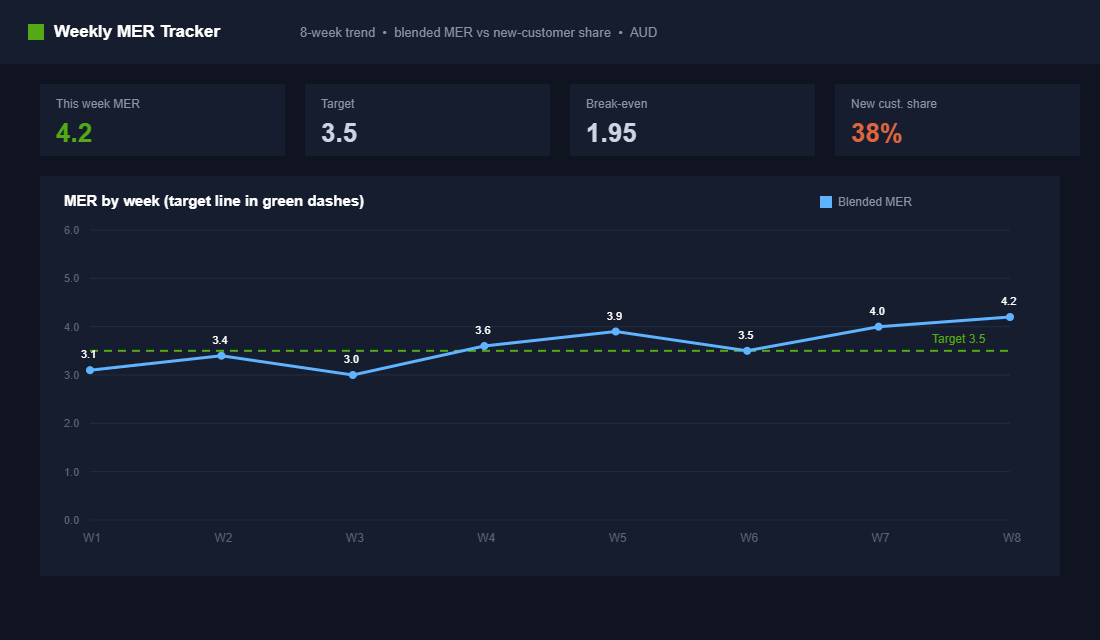
Whether you use a spreadsheet or software, the discipline is the same: one consistent definition of revenue and spend, reviewed on the same cadence every week. If you have not yet sorted your underlying tracking, fix that first with a proper conversion tracking setup so your channel-level data is at least directionally sane.
A Worked Example: Reading MER Like an Operator
Numbers make this concrete, so picture an Aussie apparel brand doing $180,000 a month. In April the founder spent $30,000 on Meta and Meta reported a 4.5 ROAS, claiming $135,000 in sales. Google reported a 3.8 on $12,000 spend, claiming another $45,600. Add the platform claims together and the ads supposedly drove $180,600, basically the entire business. The founder felt unstoppable and pushed Meta budget to $45,000 in May.
May revenue landed at $196,000. A nice lift, until you run the blended numbers. Total spend climbed from $42,000 to $57,000 while revenue rose just $16,000. April MER was $180,000 / $42,000 = 4.29. May MER was $196,000 / $57,000 = 3.44. The extra $15,000 of spend bought $16,000 of revenue at a marginal MER of barely 1.07, well below the brand break-even of 1.9. The platforms cheered. The bank account quietly went backwards.
This is the trap MER exists to catch. Platform ROAS rewarded a move that destroyed profit, because it counted sales that would have happened anyway. MER saw the truth in one division. The founder who watches MER pulls that budget back in week two. The founder who watches platform ROAS keeps scaling into a loss for another month.
Four MER Mistakes That Quietly Drain Profit
Even founders who track MER religiously trip over the same handful of errors. Here are the four that cost the most.
- Leaving fixed costs out of the picture. MER measures marketing efficiency, not net profit. A MER of 3.5 can still leave you in the red if your rent, salaries, and software are eating the contribution. Always pair MER with a profit-and-loss view.
- Forgetting that discounts move your break-even. A 20% off code does not just cut revenue, it slashes your contribution margin, which lifts the MER you need just to break even. Most founders never recalculate this during a sale.
- Counting only ad spend as marketing. Agency retainers, influencer gifting, app subscriptions, and creative production are all marketing costs. Leave them out and your MER looks healthier than your bank balance.
- Judging MER over too short a window. A single bad week of weather or a stockout can drop MER without anything being broken. Read the four-week trend, not the daily noise.
MER Through Peak Season and Sales Periods
Peak periods like Black Friday Cyber Monday bend the rules, and your MER target should bend with them. During a heavy discount window your contribution margin falls, so your break-even MER rises. If your normal break-even is 1.9 at full price, a 25% sitewide discount can push it past 2.6 before you have spent a cent on ads.
That is fine if you go in with eyes open. Many Aussie brands deliberately run a lower MER through BFCM to win new customers at scale, then bank the profit on the repeat orders through summer. The danger is running peak-season economics by accident. Recalculate your break-even MER for the exact discount you are offering, set a floor you will not breach, and watch the daily number through the event rather than waiting for the post-mortem in December.
MER and Lifetime Value: The Patience Game
A low MER is not automatically a bad MER. If your repeat purchase rate is strong and your customers come back two or three times a year, you can afford to acquire them at or even below break-even on the first order, because the lifetime value pays you back. The average repeat customer rate for most stores sits between 20 and 40%, and brands at the top of that range have far more room to push acquisition hard.
This is where MER connects to the rest of your numbers. A founder with a 45% repeat rate and a clear handle on their customer metrics can confidently run a blended MER of 2.5 and still build a profitable business, because the second and third purchases arrive with almost no marketing cost attached. A founder with a 12% repeat rate running the same MER is slowly going broke. Same number, opposite outcome, and only the operator who knows their retention can tell the difference.
The Blind Spot MER Can Hide
MER is powerful, but it has one weakness you must guard against. Because it blends all revenue together, a healthy-looking MER can mask the fact that you have stopped acquiring new customers and are simply harvesting repeat orders from your existing list.
That feels fine for a quarter, then the well runs dry. This is why sophisticated brands also watch new customer ROAS, sometimes called naROAS, which measures spend against revenue from first-time buyers only. If your blended MER is holding at 4.0 but your new customer ROAS is collapsing, you are living off past acquisition and the growth engine has stalled. Pair MER with a new customer metric and a clear read on your conversion rate benchmarks and you see the whole picture, not just the comfortable half.
The Compound Effect: How MER Changes Your Decisions
Once MER becomes your north star, your decisions get calmer and clearer. You stop panic-pausing campaigns because Meta had a bad reporting day. You stop over-crediting the channel with the loudest dashboard. You stop the weekly emotional rollercoaster of chasing platform numbers that never tied out to your bank balance anyway.
Instead you ask one question when you consider any marketing move: will this lift total revenue faster than it lifts total spend? If yes, your MER holds or climbs and you scale with confidence. If no, you have your answer before you have wasted a dollar. That single mental shift, from channel-by-channel guessing to blended truth, is what separates founders who scale profitably from those who scale themselves broke.
Your 5-Minute Weekly MER Check
Here is the simple framework to run every Monday. Block five minutes, open one spreadsheet, and answer these in order:
- Pull last week’s total revenue from Shopify Analytics.
- Add up total marketing spend across every paid channel plus agency and tool fees.
- Divide revenue by spend to get your MER for the week.
- Compare it to your break-even MER and your target. Above target means push. Between break-even and target means hold and investigate. Below break-even means stop and diagnose today.
- Check new customer revenue as a share of the total. If it is shrinking week on week, your acquisition is in trouble regardless of what the blended number says.
Do this for eight weeks and you will have a trend line that tells you more about your business than any platform dashboard ever has. You will spot a slide before it becomes a crisis, and you will make spend decisions from data you can actually trust.
Setting Your MER Target by Margin, Not by Vibes
A “good” MER is not a universal number. It is dictated by your contribution margin. The quick rule: your breakeven MER is 1 divided by your contribution margin. At a 40% margin, breakeven MER is 2.5x, so you have to clear that just to avoid losing money on marketing.
- Healthy target. Most profitable Aussie DTC brands run a blended MER of 3 to 4x. Below your breakeven multiple you are buying revenue at a loss.
- Watch acquisition MER (aMER). Total revenue divided by new-customer ad spend. It strips out the returning buyers your ads should not get credit for and tells you if new-customer acquisition actually pays.
- Read it with the 60/40 rule. If more than 60% of revenue leans on paid, your MER is masking channel-concentration risk, not proving efficiency.
Imagine blended MER looks fine at 3.2x but aMER is sitting at 1.8x. Existing customers are flattering the headline number while new-customer acquisition quietly bleeds. You would never catch it on blended MER alone, which is exactly why the metric needs a margin-aware target and a new-customer cut beside it.
Build the habit on a weekly cadence with your core metrics dashboard, then validate the spend decisions MER points to with structured A/B testing before you scale a single campaign.
Inside eCommerce Circle, getting your marketing efficiency clear is one of the core Performance pillars we work on with every member, because no amount of clever ad creative fixes a number you are not measuring honestly. If you want a second opinion on yours, let’s talk.