Most Aussie Shopify founders set their Black Friday target the same way. They look at last year’s number, add 30 or 50 percent because it feels ambitious, and write it on the whiteboard. Then they spend six weeks building creative and emails without ever checking whether the number is physically possible.
What’s in This Article
Here is the problem. A revenue target on its own is not a plan. It does not tell you how many sessions you need, what conversion rate you have to hit, how much of it email and SMS can carry, or how much ad spend it takes to buy the rest. So on the Friday of the sale, when the store is 20 percent behind by lunchtime, nobody knows which lever to pull.
The brands that hit their BFCM number do it backwards. They start with the target, strip out what their owned channels will deliver, strip out organic, and only then work out what paid has to cover and what that costs. It is a one-page reverse funnel that takes about two hours to build, and it usually exposes a gap in your assumptions before you have spent a dollar. In the worked example below, it turns a “we’ll just spend more” plan into one that grows contribution by 12 percent instead of quietly handing the extra revenue to Meta.
This is the five-step version we run with founders every September and October. Black Friday falls on 27 November 2026 and Cyber Monday on 30 November, so you have roughly eight weeks to get the maths right.
Why BFCM Targets Fail Before the Sale Starts
The stakes keep rising. The Australian Retailers Association and Roy Morgan forecast Aussies would spend $6.8 billion across the 2025 Black Friday to Cyber Monday period (ARA and Roy Morgan). Australia Post reported around $1.5 billion spent online over the four days, with 3.1 million households shopping online (up 9.2 percent) and a record 5.8 million parcels processed in a single day (MHD Supply Chain, reporting Australia Post data).
Globally, Shopify merchants did US$14.6 billion over BFCM 2025, up 27 percent, and Australia was one of the top three selling countries on the platform (Shopify).
More demand does not mean your target is safe. It means more brands competing for the same four days, higher ad costs, and more stock pressure. The targets that fail usually break in one of three places:
- The target was never broken into drivers. “$180K” says nothing about sessions, conversion or AOV, so nobody can tell on the day which one is off.
- Owned channels were assumed, not modelled. Founders guess email “will do its usual” without checking how many engaged profiles they actually have.
- Paid was treated as a plug. Whatever is left over gets handed to Meta and Google with a hopeful ROAS attached, and nobody checks whether that ROAS is consistent with November CPMs.
The reverse funnel fixes all three. Five steps, one sheet.
Step 1: Pull Last Year’s Baseline (By Day, By Channel, By Hour)
Everything starts with what actually happened last year. Not what you remember happening. What the data says.
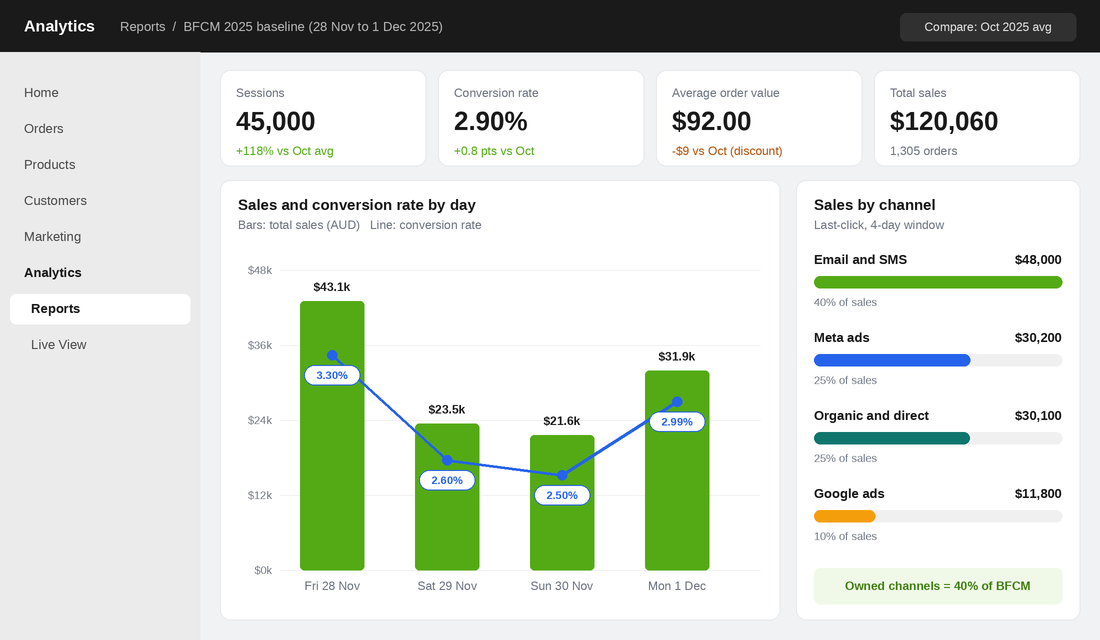
Here is how to pull it in Shopify in about 30 minutes:
- Open Analytics, then Reports. Set the date range to Friday 28 November to Monday 1 December 2025 (last year’s BFCM window).
- Pull four core numbers. Sessions, conversion rate, average order value and total sales. Write each one into a Google Sheet.
- Split sales by day. This gives you the shape of the weekend. For most Aussie brands, Friday is the biggest day, Saturday and Sunday dip, and Monday recovers.
- Switch the time grouping to hour for Black Friday. You need the hourly shape later for pacing.
- Pull sales by channel. Use Shopify’s sales by referring channel plus your Klaviyo attributed revenue for the same window. Keep the attribution window consistent year on year.
- Grab October’s averages too. Last October’s sessions, conversion rate, AOV and Meta CPC tell you how much BFCM lifted each number.
In our worked example, a skincare brand did $120,060 across the four days from 45,000 sessions at a 2.90 percent conversion rate and $92 AOV (1,305 orders). Email and SMS drove $48,000 (40 percent), Meta $30,200, organic and direct $30,100, and Google $11,800. Paid spend was about $13,550 at a blended 3.1 ROAS.
That 40 percent owned share is not unusual. Klaviyo’s 2025 BFCM report found that email and text drove 42 percent of total revenue across its customers, rising to 43 percent on peak days (Klaviyo 2025 BFCM report). If your owned share was well under 30 percent last year, that is the first thing to fix, not your ad budget.
One more rule for this step: note anything that distorted last year. A stockout on your hero SKU on Saturday, a site outage, a late-launched offer. If you do not adjust for it, you will build this year’s plan on a broken baseline.
Step 2: Set the Target From Contribution, Not Revenue
Before you write a revenue number down, decide what the four days need to leave behind after product costs, fulfilment, payment fees and ad spend. That is contribution, and it is the only number that pays your bills in January.
Why does this matter? Because revenue growth over BFCM is often bought, not earned. Push spend hard into rising November CPMs and you can grow revenue 50 percent while contribution barely moves.
Here is the quick contribution check to run on last year:
- Revenue: $120,060
- Contribution margin before ads: 43 percent (product margin after the average discount, less pick, pack, shipping and payment fees)
- Contribution before ads: $51,626
- Less paid spend: $13,548
- Contribution after ads: $38,078
Now set two numbers, not one. A revenue target and a contribution floor. For the worked example, the founder wants $180,000 in revenue (plus 50 percent) and will not accept a plan that leaves less than $42,000 in contribution (roughly 10 percent more than last year).
If you have not worked out your contribution per order yet, build the Break-Even Board first. It gives you the margin number this whole funnel relies on, plus the deepest discount an order can survive.
Two quick sanity checks on the revenue target itself:
- Is the stock there? A 50 percent revenue lift at a similar AOV means roughly 50 percent more units. Check your top 10 SKUs cover it with a buffer.
- Is the growth rate believable? If your store grew 15 percent year to date, a 50 percent BFCM lift needs a specific reason: a bigger list, a new product, a stronger offer. Write the reason down next to the number.
Step 3: Fill the Target From Owned Channels First
Owned revenue is the cheapest revenue you will get all year, so it goes in the funnel first. The mistake is guessing it. Model it instead:
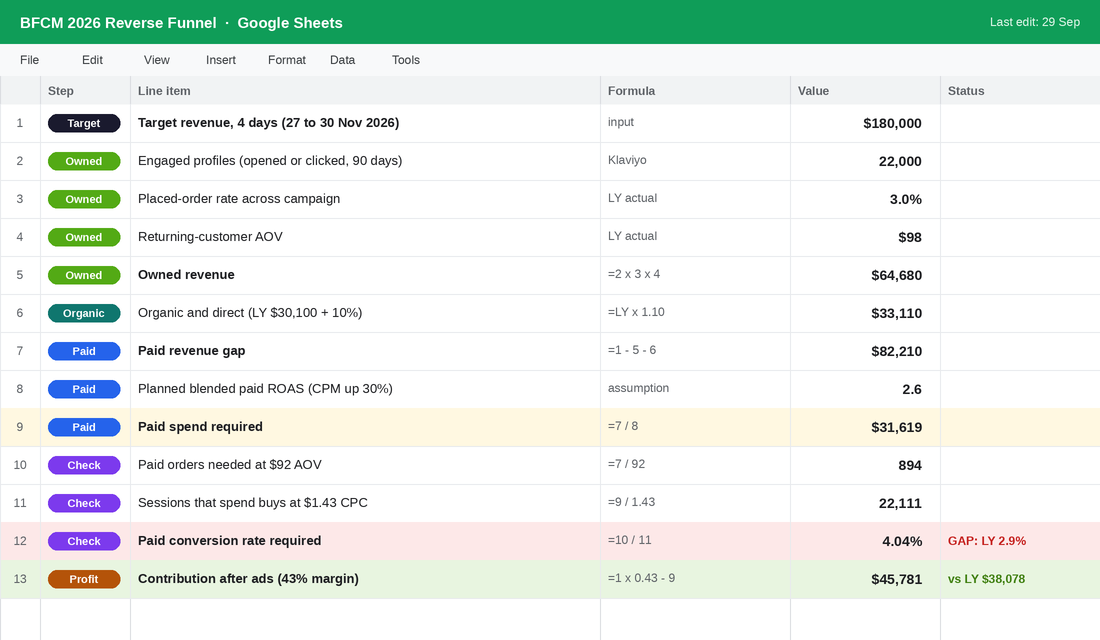
Owned revenue = engaged profiles x placed-order rate x returning-customer AOV
Here is how to get each number in Klaviyo:
- Engaged profiles. Build a segment of profiles who have opened or clicked in the last 90 days (or clicked only, if Apple Mail privacy is inflating opens on your list). In the example, that is 22,000 profiles, up from 18,000 last year.
- Placed-order rate. Last year’s BFCM campaign placed orders divided by engaged profiles at the time. For the example brand, it was 3.0 percent across the whole campaign window.
- Returning-customer AOV. Pull AOV for orders attributed to email and SMS. Returning buyers usually spend more. Here it was $98.
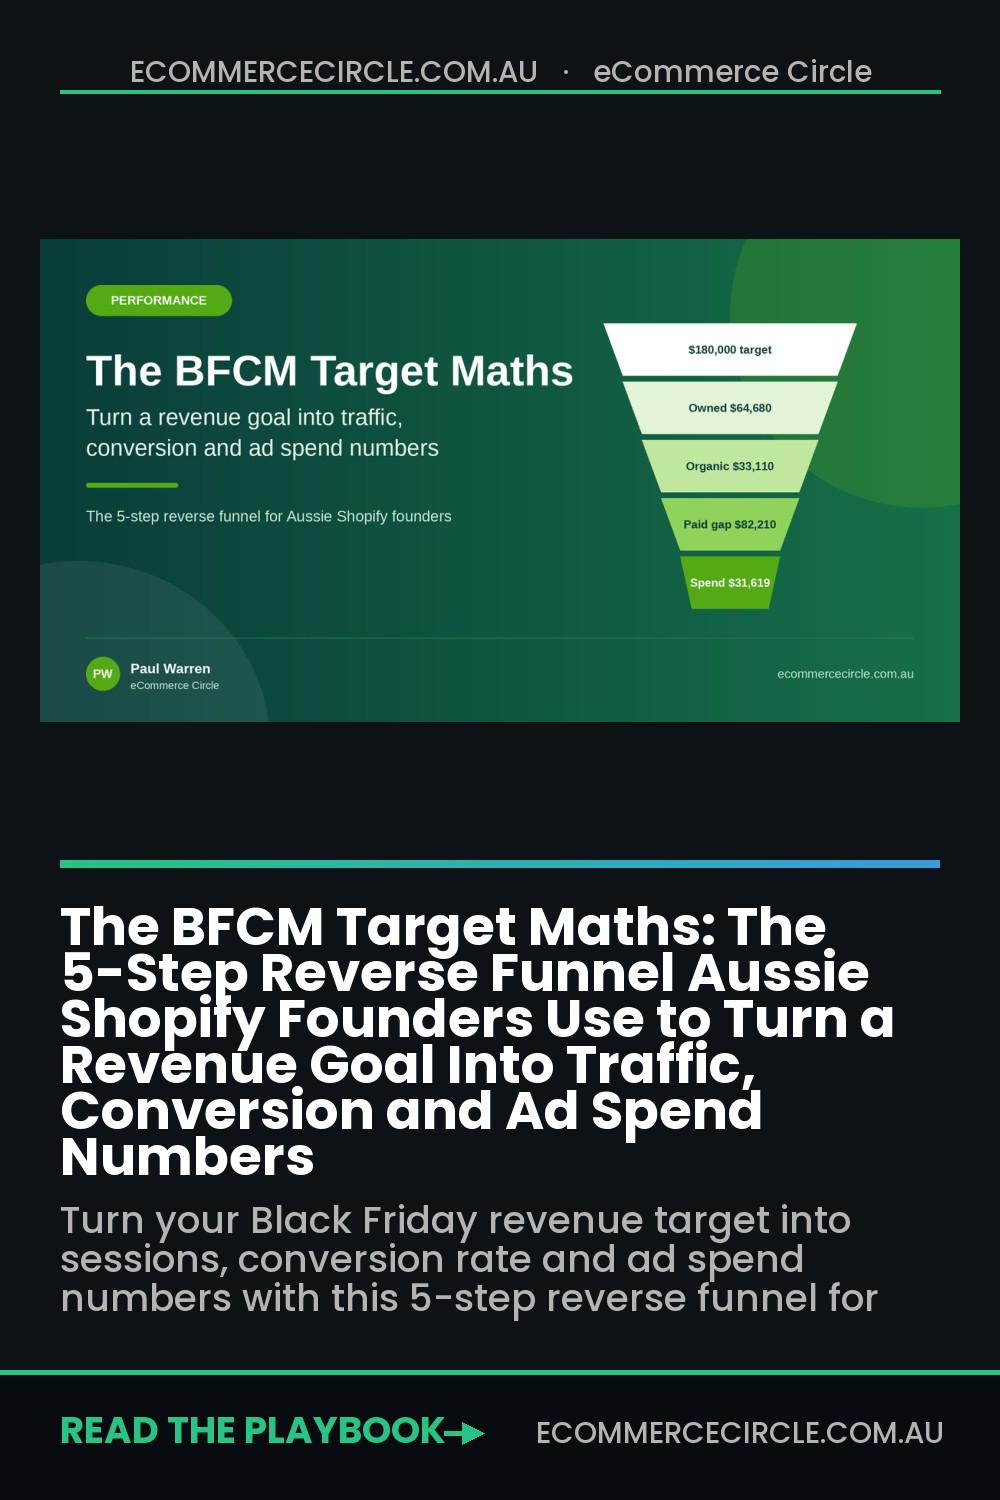
That gives 22,000 x 3.0% x $98 = $64,680 from owned channels.
Notice what this tells you about the next eight weeks. Every extra 1,000 engaged profiles you add before 27 November is worth roughly $2,940 over the four days (1,000 x 3.0% x $98). That is a concrete number you can use to justify a pre-BFCM list-building push, an early-access waitlist, or a giveaway.
It also says loyalty is doing the heavy lifting. Klaviyo found revenue from repeat customers grew 13.5 percent year on year over BFCM 2025, outpacing new buyers, and brands offering the smallest discounts grew fastest (plus 14 percent). Outdoor brand Filson is a good example. Its ecommerce team told Klaviyo it uses BFCM to give loyal customers early access to limited releases rather than just flipping on discounts (Klaviyo).
Then add organic and direct. Unless something big has changed (a new SEO win, a PR hit, a new retail partner), grow last year’s figure by your year-to-date organic growth rate. In the example, $30,100 plus 10 percent gives $33,110.
Step 4: Solve the Paid Gap, Then Check It Against Real CPCs
Now the maths gets honest. Whatever the target needs beyond owned and organic is your paid revenue gap:
$180,000 – $64,680 – $33,110 = $82,210
Most founders stop here, divide by a ROAS they like, and call it a budget. At a planned 2.6 blended ROAS (lower than last year’s 3.1 because November auctions are more expensive), that is $31,619 of spend.
Do not stop there. Run the CPC cross-check, because ROAS is an outcome, not an input:
- Paid orders needed: $82,210 / $92 AOV = 894 orders
- Expected BFCM CPC: last October’s Meta CPC was $1.10. Add 30 percent for November competition and you get $1.43
- Sessions that budget buys: $31,619 / $1.43 = 22,111 sessions
- Paid conversion rate required: 894 / 22,111 = 4.04 percent
Last year the store converted at 2.90 percent across the whole weekend. So the plan quietly assumed paid traffic would convert almost 40 percent better than last year’s store average. That is the gap, and you found it in September instead of on Black Friday afternoon.
Where does the 30 percent CPM uplift come from? It varies a lot year to year. Jon Loomer, looking at Within’s aggregate data, saw average Meta CPMs move from about $9 in October to about $12 over the 2023 holiday period (Jon Loomer). Use your own last-November CPMs if you have them. If not, model 30 percent as a base case and 50 percent as a stress case.
Now you have three honest options to close the gap:
- Lift paid conversion rate. A dedicated BFCM landing page, a clear offer above the fold, and bundles as the default choice. BFCM does lift conversion, but plan for 3.4 percent, not 4 percent.
- Lift AOV on paid orders. Lead with bundles and a threshold gift. If paid AOV moves from $92 to $100, you only need 822 orders.
- Accept more spend at lower marginal returns. This is where most brands wreck contribution. Read the Marginal ROAS Playbook before you raise budgets, because the last $5,000 always performs worse than the first.
Re-solve with realistic numbers. At $100 AOV and 3.4 percent paid conversion: 822 orders need 24,176 sessions, which costs $34,572 at $1.43 CPC. Contribution after ads becomes $77,400 – $34,572 = $42,828. That clears the $42,000 floor, and you know exactly which two levers (AOV and landing page conversion) the plan depends on.
If the re-solve does not clear the floor, lower the revenue target. A $165,000 plan that leaves $44,000 is a better BFCM than a $190,000 plan that leaves $36,000.
Step 5: Turn the Plan Into Daily and Hourly Pacing Targets
A four-day number is useless at 11am on Black Friday. Break it into day targets using last year’s shape, then into hourly curves for the big days.
From Step 1, the example brand’s weekend split was Friday 35.9 percent, Saturday 19.5 percent, Sunday 18.0 percent and Monday 26.6 percent. Applied to $180,000, that gives:
- Friday 27 November: $64,600
- Saturday 28 November: $35,100
- Sunday 29 November: $32,400
- Monday 30 November: $47,900
Then use last year’s hourly curve for Friday and Monday to build a cumulative plan line. If 43 percent of last year’s Black Friday sales had landed by 2pm, your 2pm target this year is 43 percent of $64,600, or about $27,800.
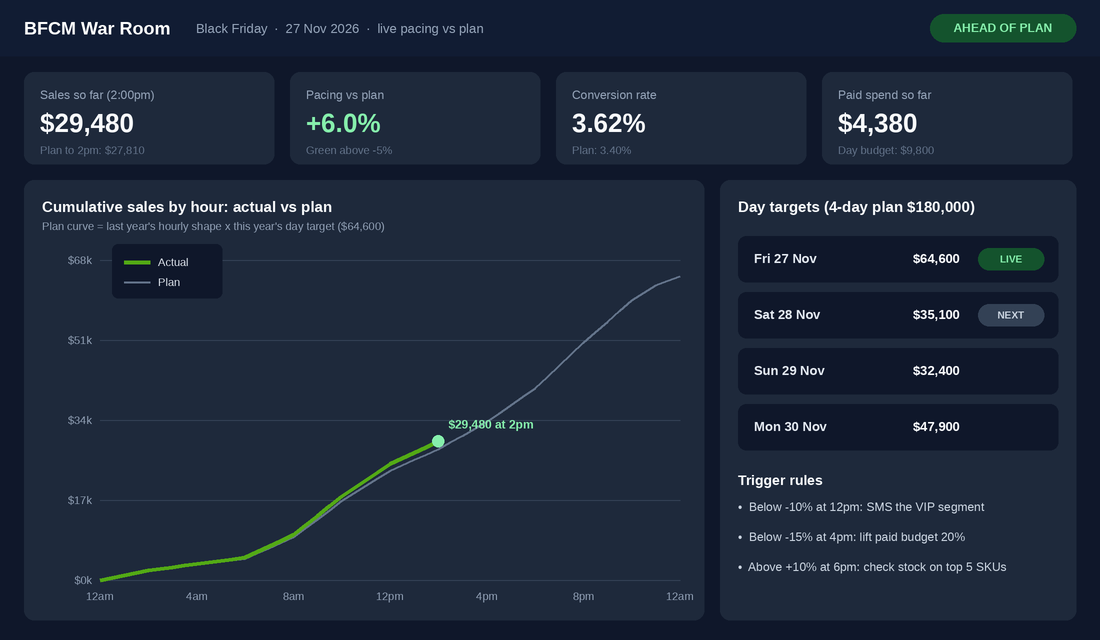
The pacing line only earns its keep if it is attached to decisions. Agree trigger rules before the sale, when you are calm:
- Below -10 percent at 12pm: send the SMS to your VIP segment early.
- Below -15 percent at 4pm: lift paid budgets 20 percent on the top two ad sets only.
- Above +10 percent at 6pm: check stock cover on your top five SKUs and pause ads on anything under two days of cover.
- Conversion rate down but sessions on plan: check the site, the checkout and the discount code before you touch ads.
Paste the hourly plan into a Google Sheet, then check Shopify’s Live View at set times (10am, 12pm, 2pm, 4pm, 6pm, 9pm). One person owns the sheet. One person owns the decisions. If you run a separate Click Frenzy or early-access event earlier in November, build a second pacing sheet for it. The November Double Peak article walks through how to split offers and stock between the two.
The Worked Example: What Changed Once the Maths Was Honest
Here is the before and after for the example brand, side by side:
- Original plan: $180,000 revenue, $31,619 spend, relied on a 4.04 percent paid conversion rate nobody had ever seen on this store.
- Revised plan: $180,000 revenue, $34,572 spend, 3.4 percent paid conversion and $100 paid AOV, with a dedicated landing page and a bundle-led offer to deliver both.
- Owned push: a six-week early-access waitlist to add 3,000 engaged profiles, worth roughly $8,800 in extra owned revenue as a buffer.
- Contribution: $42,828 planned versus $38,078 last year, a 12 percent lift, with the buffer on top.
The revenue target never changed. What changed was that the founder now knows which three numbers have to move, who owns each one, and what happens on the day if they do not.
There is also a strong case for not chasing the deepest discount to get there. When Allbirds raised prices by $1 on Black Friday 2020 and donated the difference to climate action, it proved a brand can run a BFCM story without racing to the bottom. Klaviyo’s 2025 data backs the same idea: discount depth fell about 10 percent year on year, yet spending still rose 11 percent.
Why the Reverse Funnel Compounds
Each step makes the next one sharper:
- The baseline stops you planning off memory.
- The contribution floor stops revenue growth that loses money.
- The owned model puts a dollar value on every profile you add in October, so list-building gets real attention.
- The CPC cross-check catches the optimistic assumption hiding inside your ROAS target.
- The pacing sheet turns the plan into decisions you can make at 2pm on Friday, not excuses on Tuesday.
And the sheet does not get thrown away on 1 December. Fill in the actuals column the week after the sale and you have next year’s baseline ready, with every assumption tested. Do this for three years and your BFCM forecast will land within 10 percent, which is what lets you order stock and commit ad budgets with confidence. If you want to extend the same driver-based method to the whole year, the FY27 budget build uses exactly this approach across 12 months.
Your BFCM Reverse Funnel Template
Copy these rows into a Google Sheet and fill them in this week:
- Row 1, Target revenue: your four-day goal (Friday 27 to Monday 30 November 2026).
- Row 2, Contribution floor: the minimum contribution after ads you will accept.
- Row 3, Contribution margin before ads: product margin after average discount, less fulfilment and payment fees.
- Row 4, Engaged profiles: Klaviyo 90-day engaged segment count, projected to 27 November.
- Row 5, Placed-order rate: last year’s campaign orders divided by engaged profiles.
- Row 6, Returning-customer AOV: from last year’s email and SMS attributed orders.
- Row 7, Owned revenue: Row 4 x Row 5 x Row 6.
- Row 8, Organic and direct: last year’s figure x your year-to-date organic growth.
- Row 9, Paid revenue gap: Row 1 – Row 7 – Row 8.
- Row 10, Paid AOV: realistic, with your bundle or threshold offer.
- Row 11, Paid orders needed: Row 9 / Row 10.
- Row 12, Expected BFCM CPC: last October CPC x 1.3 (base) and x 1.5 (stress).
- Row 13, Paid conversion rate: what you can realistically deliver, sanity-checked against last year.
- Row 14, Sessions needed: Row 11 / Row 13.
- Row 15, Paid spend: Row 14 x Row 12.
- Row 16, Contribution after ads: Row 1 x Row 3 – Row 15. Must clear Row 2.
- Row 17, Day targets: Row 1 split by last year’s day shape.
- Row 18, Trigger rules: three to five pre-agreed actions tied to pacing percentages.
If Row 16 does not clear Row 2, change the drivers or change the target. Never just change Row 1 and hope.
Benchmarks to Sense-Check Your Numbers
Use these as guardrails, not goals. Your own history beats any benchmark.
- Owned share of BFCM revenue: 35 to 45 percent for a healthy list. Klaviyo’s 2025 average was 42 percent.
- Paid CPC uplift in November: model 30 percent (base) and 50 percent (stress) over October.
- Discount depth: Klaviyo reported daily average discounts never exceeded 30 percent across its brands in 2025, and the smallest discounters grew fastest.
- Average cart: Shopify’s global BFCM 2025 average cart was US$114.70. If your AOV drops sharply over BFCM, your offer is probably training smaller baskets.
- Forecast accuracy: within 15 percent in year one, within 10 percent by year three.
Where to Start This Week
Block two hours before Friday. Pull the baseline, build the 18 rows, and run the CPC cross-check. If the sheet tells you the target only works with a conversion rate you have never achieved, you have just saved yourself a very expensive November.
Inside eCommerce Circle, Performance is one of the core pillars we work on with every member, because a number you cannot break down is a number you cannot manage. If you want to see exactly where your store is being capped, take the free More Orders Scorecard. It takes two minutes, there is no obligation, and it shows you which of the 10 P’s to fix first.