Ask most Aussie Shopify founders how the store is going and you will get a revenue number. Ask them how many orders a day they need before the business pays for itself and the room goes quiet.
What’s in This Article
That gap is where a lot of good brands quietly bleed. You can grow revenue 40% in a year, hire two people, upgrade the warehouse, and finish with less cash than you started with. Nothing went wrong on any single order. The fixed cost base just grew faster than the contribution coming in behind it, and nobody was watching the number that connects the two.
The numbers back that up. Eightx’s 2026 review of ASX-listed Australian direct-to-consumer brands found gross margin across the cohort spanning 16.1% at Cettire to 82.9% at Lovisa, and three of the ten posted statutory losses for FY2025. These are listed companies with CFOs and board packs. If they can grow revenue into a loss, a $3m Shopify store running on gut feel absolutely can.
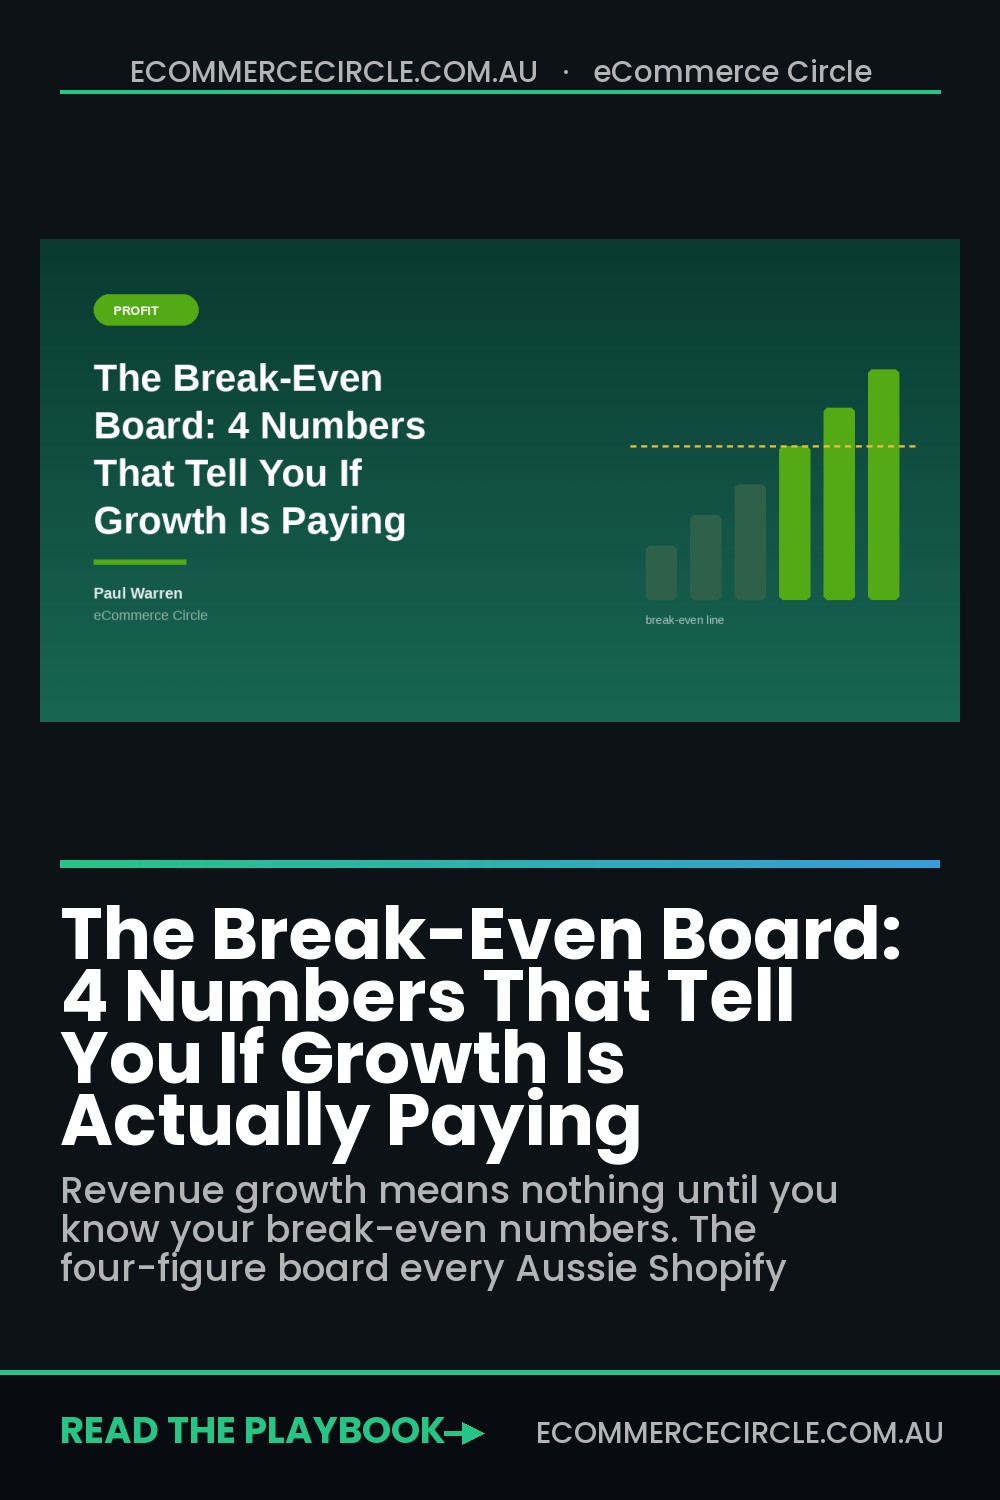
The fix is not a new dashboard app. It is four numbers, written down, reviewed monthly. We call it the Break-Even Board, and it is the first thing we build with a member who says “we’re busy but there’s no money left”.
Revenue tells you nothing until you know what one order leaves behind
There are two profitability questions and they get confused constantly.
The first is is this order profitable. That is unit economics: what one sale leaves behind after the cost of goods, the pick and pack, the freight, the payment fee and the ad spend that bought it. The second is is this business profitable. That is fixed costs: wages, rent, software, retainers, loan repayments, the things that get paid whether you sell one unit or a thousand.
Break-even is the bridge between them. It answers a single question: how much volume, at your current unit economics, does it take to cover the cost base you have already committed to?
Most operators have never done this maths because the inputs live in three different places. Gross margin sits in Shopify. Freight and pick-pack sit in a 3PL invoice. Wages and rent sit in Xero. The Break-Even Board pulls them onto one page.
Number one: contribution per order
Contribution per order is what a single sale leaves behind for the business after every cost that moves with that sale. It is not gross margin, and the difference between the two is where most of the confusion lives.
Work it in this order for a typical order, not your best one:
- Start with average order value. Use the last 90 days, net of discounts and returns, not the headline number on your product page.
- Subtract landed cost of goods. Landed, so include freight in, duties and any FX cost, not just the supplier invoice.
- Subtract pick, pack and outbound freight. Take the real 3PL invoice divided by orders, including consumables and any peak surcharges.
- Subtract payment processing. Roughly 1.75% to 2.4% depending on your mix of card, PayPal and buy now pay later.
- Subtract returns cost. Return rate multiplied by the cost of handling and restocking a returned order, spread across all orders.
What is left is contribution. Whether you subtract ad spend here is a choice: leave it out and you get contribution before marketing, which is the cleanest number for the board. Track marketing separately as a percentage of revenue.
Benchmarks give you a sanity check. Median gross margin across public DTC brands sits at 57%, with the 25th percentile at 46% and the 75th at 64%. But after every variable cost, real contribution margin for most brands lands between 15% and 20% of revenue, with shipping alone eating 8% to 12%. If your maths says 45% contribution, you have missed a cost line.
For the worked example running through this article, we will use an Australian homewares brand: $142 average order value, 58% gross margin, $11.80 pick pack and freight, $2.90 payment fees. Contribution per order comes out at $67.66 before marketing. If you have not pulled these numbers apart before, start with our contribution margin audit and come back.
Number two: break-even orders per day
This is the number that changes how you think about the business, because it converts an abstract cost base into a daily target anyone on the team can understand.
Add up every fixed cost for a month. Wages and super. Warehouse lease and utilities. Shopify Plus and every app subscription. Agency and contractor retainers. Insurance, accounting, software. Loan and equipment repayments. Be honest and include your own drawings, because a business that only breaks even when the founder works unpaid has not broken even.
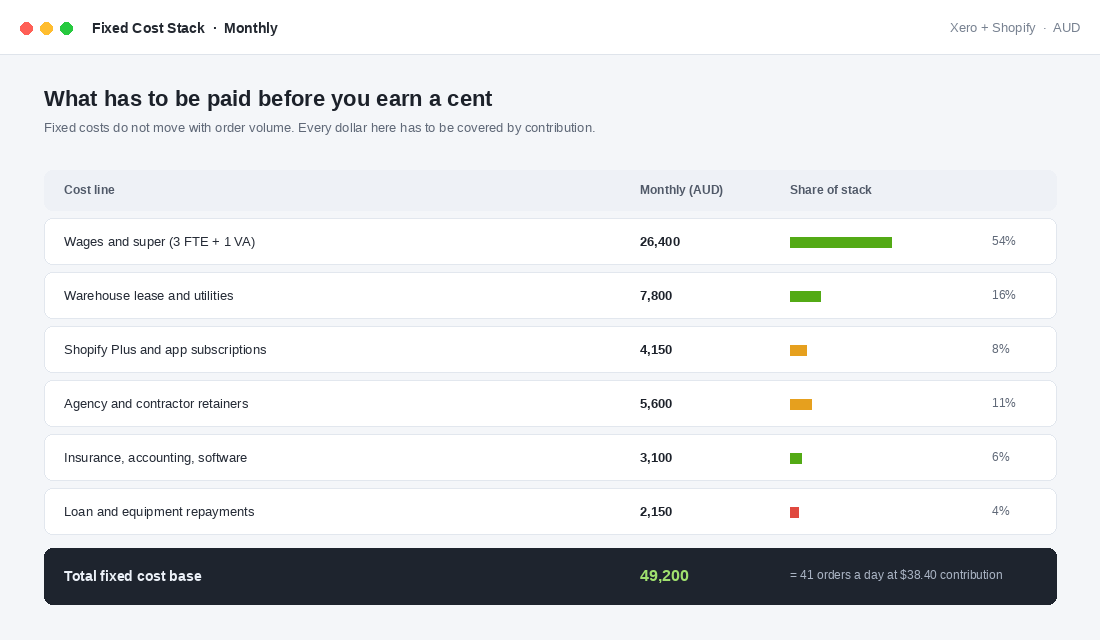
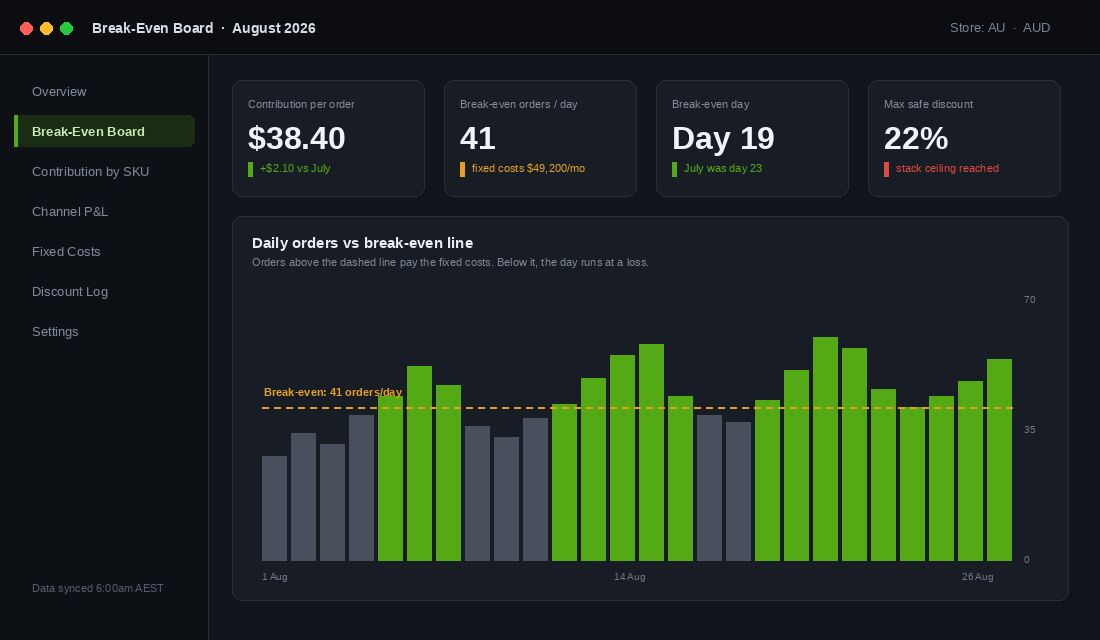
Our example brand lands at $49,200 a month. Take a haircut on contribution for marketing spend and blended discounting, and say the real average contribution per order is $38.40. Divide $49,200 by $38.40 and you get 1,281 orders a month. Divide by 30 and you get 41 orders a day.
Now you have a line to draw across your daily orders chart. Every day above 41 pays for itself and pushes the business forward. Every day below it is funded by the days above. Suddenly a quiet Tuesday is not a vibe, it is a measurable gap you can size.
Two things happen the first time a founder sees this. They realise how many days of the month are underwater, and they realise how quickly one new hire moves the line. A $95k salary package adds about $7,900 a month in fixed cost, which is another 7 orders a day, every day, forever. That is the real question to answer before you post the job ad.
Number three: break-even day, the date your store starts earning
Orders per day is the operating number. Break-even day is the one that lands emotionally, and it is the one your team will actually remember.
Take your cumulative contribution through the month and mark the date it crosses your fixed cost base. That is the day the store stops paying the bills and starts paying you. In our example, the brand crosses $49,200 of cumulative contribution on day 19. Days 20 to 31 are the profit.
Track it every month and it becomes the cleanest health signal you have:
- Break-even day moving earlier means the business is getting more efficient, regardless of what revenue did.
- Break-even day moving later while revenue grows is the classic scaling trap. You are buying revenue with fixed cost.
- Break-even day past day 26 means you have roughly four days of profit a month protecting you from a bad ad account, a supplier delay or a slow debtor.
That last point matters more in Australia than most founders account for. Average debtor days across Australian SMEs sit between 45 and 65, and more than half of all invoices issued by Australian small businesses are paid late. If you sell wholesale alongside DTC, your break-even day and your cash break-even day are not the same date, and the gap is where stores get caught. That is a job for a rolling cash flow forecast sitting next to this board.
Number four: the deepest discount an order survives
Once you know contribution per order and the contribution you need per order, you can answer a question most brands guess at: how far can we discount before an order stops paying its share of the fixed costs?
The maths is unforgiving because discounts come off the top line while your cost of goods does not move. A 20% discount on a product carrying 50% gross margin cuts that margin to 37.5%, a 25% fall in profit on that order. You do not feel it because the order still looks like a sale in the Shopify dashboard.
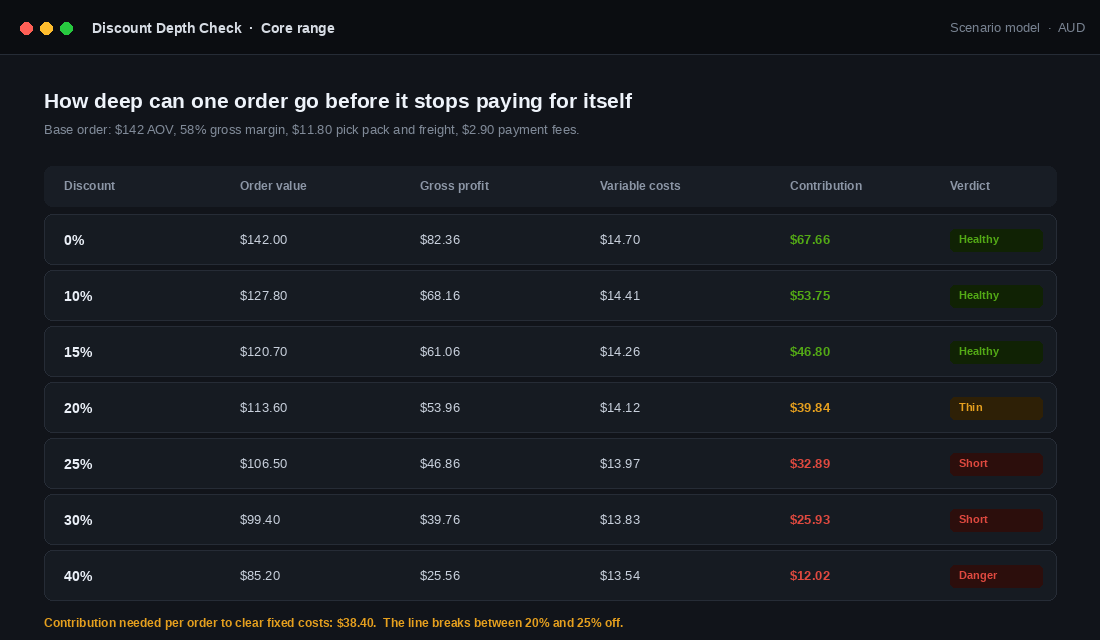
For our brand, contribution holds up to 20% off at $39.84, just clearing the $38.40 needed. At 25% off it drops to $32.89 and the order no longer carries its share. That is the ceiling. Anything deeper has to be justified by something other than this order: a genuine new customer, a dead stock clearance, a contractual wholesale term.
Two more things to build into the ceiling. First, stacking. A 15% welcome code plus a 10% email code plus free shipping can strip 30% to 40% of an order’s margin, and most stores allow it by accident. Set combination rules in Shopify Discounts deliberately. Second, cannibalisation. Broad public coupons cannibalise 20% to 60% of orders that would have happened at full price, and industry analysis suggests 50% to 60% of promotions fail to deliver a positive return. Your discount ceiling should assume most redemptions were not incremental. If discounting has become a reflex in your calendar, our discount discipline framework gives you the promotion architecture to replace it.
Build the board in one afternoon
You do not need a data warehouse. You need one spreadsheet and one connected tool. The fastest path for a Shopify store is Lifetimely by AMP, which builds a real profit and loss from your Shopify data and lets you enter cost lines it cannot see.
Setup, start to finish:
- Install Lifetimely from the Shopify App Store and let the initial historical sync run. It usually takes a few hours for a store with meaningful order history.
- Load cost of goods per variant. Go to Settings, then Costs, and upload a CSV of variant SKU and landed cost. Landed, not supplier invoice. This single step is what separates a real P&L from a revenue report.
- Enter shipping and handling costs. Add your per-order pick and pack rate and your average outbound freight. If your 3PL charges by cubic weight, take last month’s invoice divided by orders shipped rather than the rate card.
- Connect your ad accounts. Meta and Google at minimum, so blended marketing cost lands in the same view instead of a separate tab.
- Add fixed costs as recurring expenses. Wages, rent, software, retainers, repayments, drawings. This is the step most people skip, and without it the tool only answers half the question.
- Open the P&L view and record three figures in a sheet: contribution per order, total monthly fixed costs, and orders for the month. The rest of the board calculates itself.
Prefer to stay in a spreadsheet? Pull orders and net sales from Shopify Analytics, cost of goods from your inventory system, freight from the 3PL invoice, and fixed costs from your Xero profit and loss with the marketing and cost of sales lines stripped out. Fifteen minutes a month once the template exists.
The four moves that shift the whole board
Once the board exists, every growth decision gets tested against it. There are only four levers, and they are not equally easy.
- Raise contribution per order. A price rise of 4% on a 58% margin product lifts contribution roughly 10%. Bundling, a smarter free shipping threshold and cutting your worst-performing SKUs all work here. This is usually the fastest lever and the one founders avoid.
- Cut variable cost. Renegotiate freight rates, fix your packaging cube, reduce returns with better size guidance. Every dollar saved here drops straight into contribution on every future order.
- Cut fixed cost. Audit the app stack, question every retainer, and treat subscriptions as annual commitments rather than monthly conveniences. Adore Beauty grew EBITDA 67.8% to $8.1m on $198.8m of revenue in FY2025, a 4.1% margin, largely by holding the cost base while the top line moved.
- Lift order volume. The obvious lever and the slowest, because it costs money to buy and the acquisition spend comes out of the same contribution you are trying to protect.
Note the order. Most operators reach for volume first because it feels like growth. The board tells you that a 5% lift in contribution per order and a $4,000 cut to the fixed base can move break-even day forward further than a month of extra ad spend, and neither of them costs you cash to implement.
Why these four numbers compound
Individually each number is useful. Together they form a decision filter, and that is where the value sits.
Someone proposes a 30% off flash sale. The board says your ceiling is 20%, so the answer is either no or the sale runs on a specific subset of stock where you have already decided the contribution rule does not apply. No debate, no vibes.
You want to hire a second customer service person. The board converts that into 7 extra orders a day and asks whether the hire will generate them. Sometimes the answer is yes, because service quality drives repeat rate. Now it is a case you have to make with numbers rather than a cost you absorb quietly.
Your supplier lifts prices 6%. The board tells you within two minutes what that does to contribution per order, how many extra orders a day you now need, and how many days later break-even day moves. You know whether to absorb it, pass it on, or renegotiate freight to offset it, before the first affected shipment lands.
That is the compounding effect. Not one big insight, but a hundred small decisions made against the same reference point, month after month. It is also why the board belongs in your monthly review, not in a folder. Sixty per cent of Australian businesses fail within their first three years, and very few of them fail because nobody worked hard enough.
Your Break-Even Board template
Copy this into a sheet and fill it in this week. Ten rows, one page, reviewed on the first Monday of every month.
- Average order value, last 90 days, net of discounts and returns.
- Landed cost of goods per order.
- Pick, pack and outbound freight per order, from the actual invoice.
- Payment processing and returns cost per order.
- Contribution per order = row 1 minus rows 2, 3 and 4.
- Total monthly fixed costs, including your own drawings.
- Break-even orders per day = row 6 divided by row 5, divided by days in the month.
- Break-even day = the date cumulative contribution crosses row 6.
- Maximum discount depth = the discount at which contribution falls below row 6 divided by monthly orders.
- Movement versus last month on rows 5, 7 and 8, with one sentence explaining why.
Row 10 is the one that matters. A number without a direction is trivia. A number with a direction and a reason is management.
If you build nothing else this month, build rows 5, 6 and 7. Contribution per order, fixed cost base, orders a day. Three figures, one afternoon, and you will never look at a revenue milestone the same way again.
Inside eCommerce Circle, break-even economics is one of the core pillars we work on with every member, because almost every other decision hangs off it. If you want a second opinion on yours, let’s talk.