You picked your price by looking sideways. Three competitors, a quick scan of their product pages, and you landed somewhere in the middle. Maybe you added a few dollars because your packaging is nicer. Then you told yourself you would revisit it once things settled down.
What’s in This Article
That was probably eighteen months ago, and since then your landed cost has moved, your freight has moved, and your ad costs have moved. The one number that never moved is the one that moves profit hardest.
McKinsey’s analysis of S&P 1500 companies found that a 1% price rise, with volumes held steady, lifts operating profit by roughly 8%. That is close to three times the impact of a 1% lift in volume. Every founder I speak to is chasing volume. Almost none of them have ever asked a customer what they would actually pay.
There is a way to ask that does not rely on gut feel, and it takes four questions.
Most Aussie brands price by looking sideways
Competitor matching feels safe because it is checkable. You can point at a screenshot and say the market sits at forty dollars. What you cannot see in that screenshot is the other brand’s landed cost, their freight deal, their return rate, or whether they are quietly losing money on every order to hold share.
You are copying the output of someone else’s spreadsheet without any of the inputs. If their maths is wrong, yours is now wrong too, and you have anchored an entire catalogue to it.
The Australian market makes this worse right now. NAB’s Consumer Sentiment Survey for the March 2026 quarter found 57% of Australians switched at least one provider in the past year because of rising prices, with the Consumer Stress Index hitting 59.1, the highest reading since 2014. Separately, around 71% of Australian online shoppers say rising costs have changed what and where they buy.
Read that the wrong way and you conclude everyone is hunting the cheapest option, so you should never raise a price. Read it properly and you notice something more useful: a large share of your market is actively re-evaluating what things are worth. They are forming fresh price expectations right now. You are allowed to be part of that conversation instead of guessing at the outcome.
Why the guess is costing more than you think
Price is the only lever that moves profit without moving anything else. A discount does not just cost you the discount. It costs you the discount on every unit you would have sold anyway.
The McKinsey work puts a hard number on the reverse trade. To recover the profit lost from a 5% price cut, volume has to rise by 18.7%. Almost nobody models that before they run the sale. They see the revenue spike, feel good about the week, and never check what happened to contribution.
Run the same logic on a real product. A merino crew neck with a landed cost of $17.40 sold at $39.00 earns $21.60 a unit. Sell a thousand a month and that is $21,600 of gross contribution. Lift the price to $48.38 and unit contribution becomes $30.98. Even if you lose 9% of your units, the month finishes about 30% ahead.
The question is not whether higher prices are more profitable. Of course they are, up to a point. The question is where that point sits, and that is an empirical question about your customers, not a philosophical one about your brand.
The four questions that replace the guesswork
The method is called the Price Sensitivity Meter, built by Dutch economist Peter van Westendorp in 1976. It has survived fifty years because it is stubbornly simple and it self-corrects.
You show a respondent one clearly described product and ask four open-ended price questions. Not multiple choice. They type a number.
- At what price would this be so cheap you would question the quality? (too cheap)
- At what price would this feel like good value? (a bargain)
- At what price would this start to feel expensive, but you would still consider it? (getting expensive)
- At what price would this be so expensive you would not consider buying it? (too expensive)
Four questions add about two to three minutes to a survey, which is why it slots neatly into research you are already running. The reason it works better than simply asking “what would you pay” is that it forces the same person to reason about price from four different directions. Someone who anchors low on one answer gets caught by their own answers on the other three.
One detail that is specific to selling in Australia: state clearly that all prices include GST. Australian shoppers are used to seeing the final price on the shelf, so they will answer with a GST-inclusive number whether you tell them to or not. If you then read those answers as if they were ex-GST, your entire band lands about 9% too high and the first price move you make will overshoot.
Wording matters more than founders expect. Describe the product exactly as a buyer would encounter it, including the size, the material, and what is included. If you are testing a subscription, state the delivery frequency and the commitment. A vague stimulus gives you a vague band.
What the four crossing points actually tell you
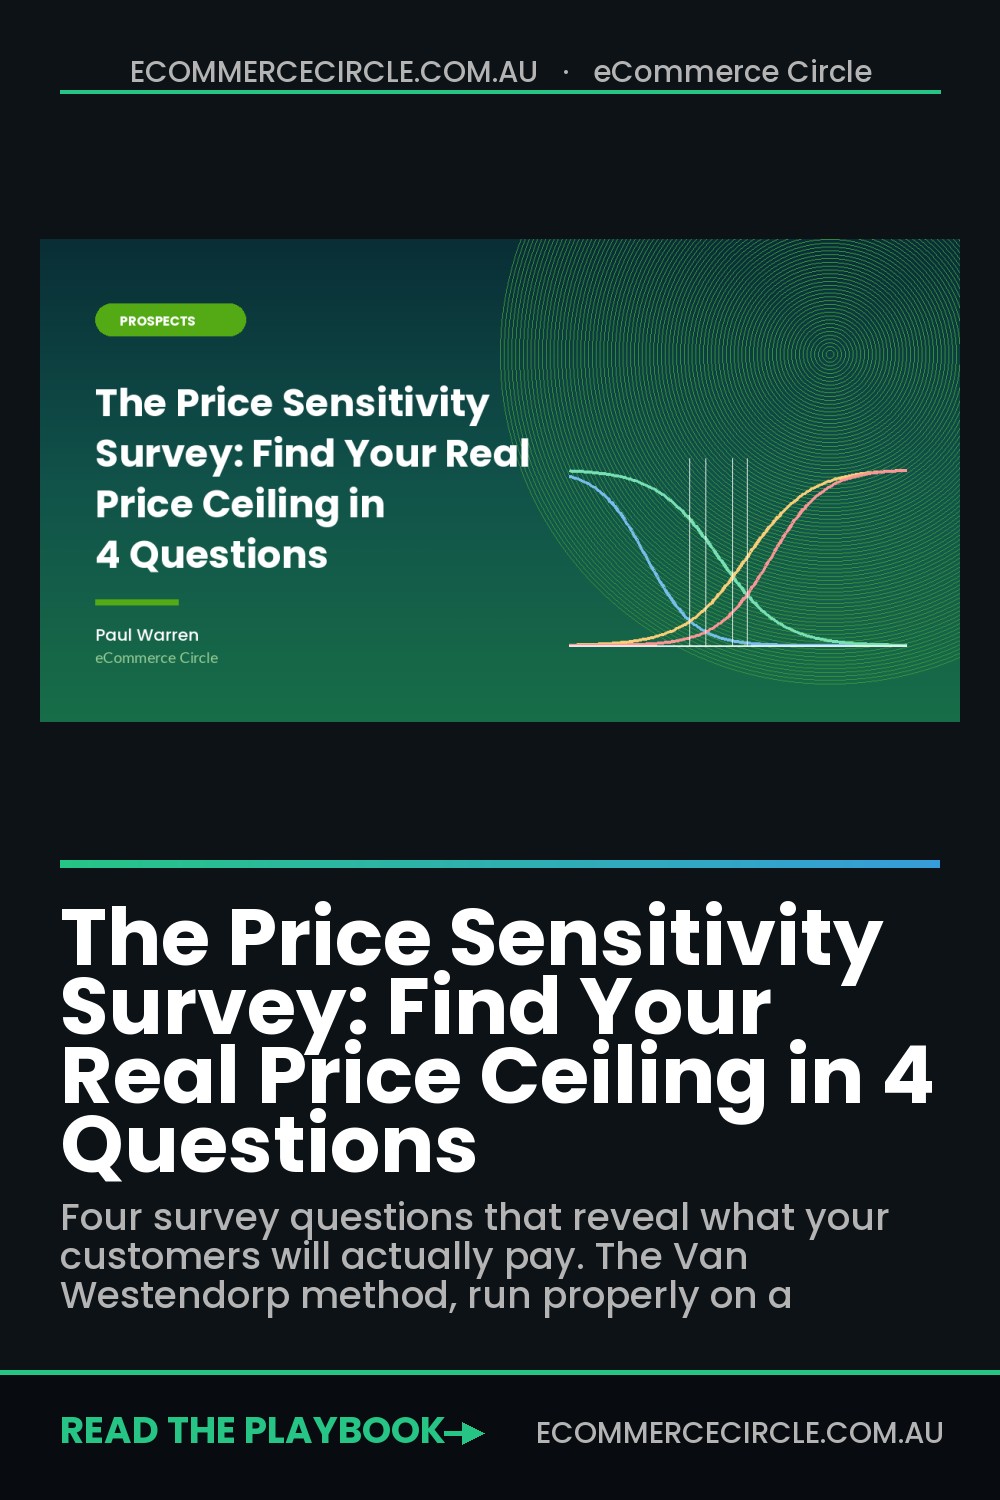
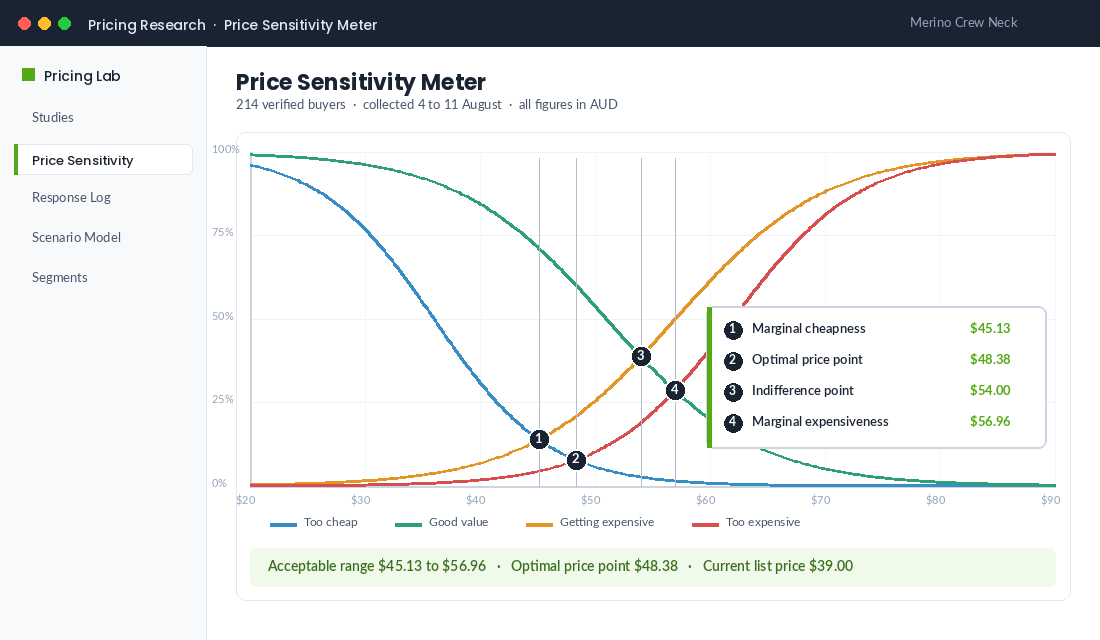
Plot the four answers as cumulative curves and they intersect at four points. Each one answers a different commercial question.
- Point of marginal cheapness. Where “too cheap” crosses “getting expensive”. Below this, quality doubts start outweighing the value story. This is your floor.
- Optimal price point. Where “too cheap” crosses “too expensive”. The price at which the fewest people reject you outright in either direction. The safest single number to move to.
- Indifference price point. Where “good value” crosses “getting expensive”. Often close to what the market leader charges, or what your buyers already expect to pay.
- Point of marginal expensiveness. Where “good value” crosses “too expensive”. Your ceiling. Past this, resistance climbs faster than margin.
In the example above, the band runs from $45.13 to $56.96, with the optimal point at $48.38. The store was charging $39.00. That is not a rounding error. That is roughly ten dollars a unit sitting outside the range customers themselves described as acceptable.
This is the pattern I see most often with Aussie founders under about $500k a month. The number is not too high. It is well under the floor, and it has been for two years, because the price was set when the brand was unproven and never revisited once the reviews, the photography, and the delivery promise caught up.
How to run the survey on a Shopify store in seven days
You do not need a research agency. You need a survey form, a customer segment, and a spreadsheet.
Day 1: build the form
Use Google Forms if you want free, or Typeform if you want a better completion rate. Create five fields: a short product description block, then four short-answer numeric questions in the order listed above. Set each to accept numbers only and mark all four required.
Add one screening question at the top: “Have you bought from us in the last 12 months?” You will want to cut the data by buyer and non-buyer later.
Day 2: pick the sample and write the send
Build a Klaviyo segment of people who placed an order in the last twelve months. Target at least 200 completed responses. Practitioners treat 150 to 200 as a working minimum and prefer 200 to 400 when you plan to cut by segment. Below about 100 responses the crossing points jump around with every new answer and you cannot defend the result.
Assume a completion rate somewhere between 5% and 10% on a cold list, better on an engaged one, so send to a few thousand contacts. Offer a small incentive, but never a discount code. A discount primes people to think about price the wrong way. Use a store credit draw or free shipping instead.
Day 3 to 5: collect and clean
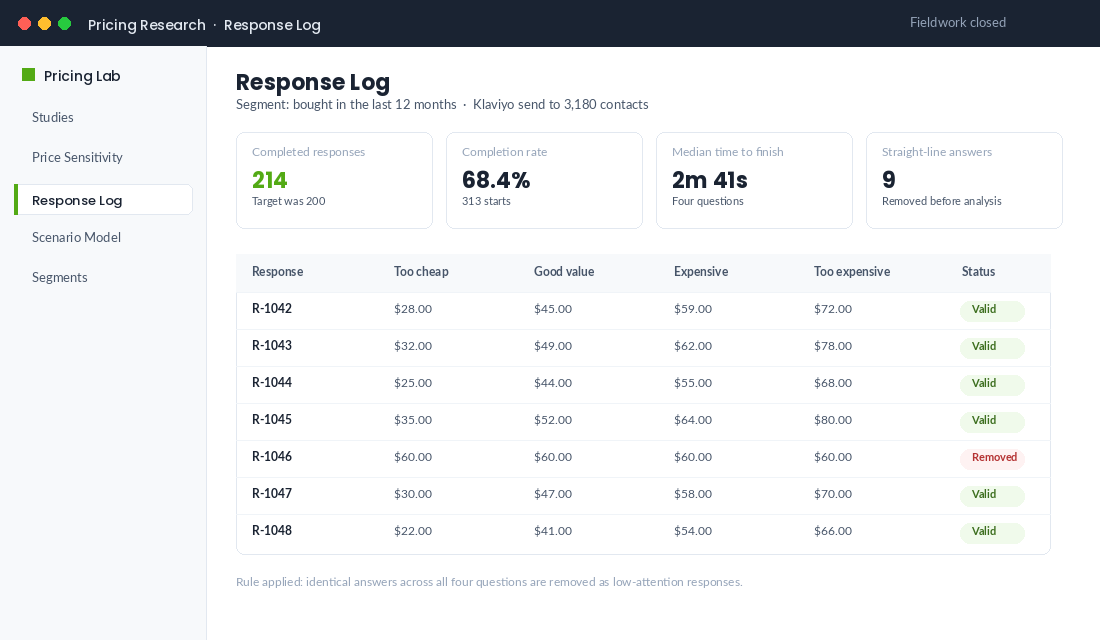
Let it run for three days. Then remove two kinds of junk. First, anyone who entered the identical number for all four questions, because they were clicking through. Second, anyone whose answers are not in a logical order, where the “too expensive” figure sits below the “good value” figure.
Expect to lose 4% to 8% of responses to cleaning. That is normal and it is why you aim past your target.
Day 6: plot the curves
In Google Sheets, build a price column in one dollar steps across your full range. For each price, calculate the percentage of respondents who put that price at or below their “too cheap” and “good value” figures, and at or above their “getting expensive” and “too expensive” figures. Chart all four as lines. Read the crossings.
If you would rather not build it yourself, Conjointly and Qualtrics both ship a Van Westendorp template that plots the chart automatically. For a single product test the spreadsheet is genuinely quicker.
Day 7: model the money
A price band is not a decision. Take the four points into a contribution model with your real landed cost, your real return rate, and an honest volume assumption for each price. Then pick your test.
The five mistakes that produce a useless price band
- Surveying the wrong people. Asking your whole list, including people who have never bought, gives you the price expectations of browsers. Run buyers and non-buyers as separate cuts. They will not agree, and the gap between them is the most interesting thing in the study.
- Describing the product vaguely. “A merino jumper” and “a 100% Australian merino crew neck, machine washable, free returns” produce different bands. Show the stimulus you actually sell.
- Using multiple choice. The moment you offer price options you have anchored the answer. Open numeric fields only.
- Stopping at 60 responses. The curves look fine and the crossings are noise. Get to 200.
- Treating the optimal point as the answer. It is the safest step, not the best price. The model says nothing about how many units you sell, only about how many people reject the number.
The buyer and non-buyer split is worth running properly rather than treating as a nice-to-have. Buyers price from experience. They have held the product, they know how it washed, and they are pricing the thing itself. Non-buyers price from the product page, so they are really pricing your photography, your reviews, and your delivery promise.
When the non-buyer band sits well below the buyer band, you do not have a price problem. You have a proof problem, and cutting the price will make it worse by confirming the low expectation. When the two bands sit close together, your presentation is doing its job and the price band is safe to act on.
That last one matters most. The Price Sensitivity Meter measures acceptability, not demand. It tells you where you are allowed to play. It does not tell you where you make the most money inside that range.
Turning a price band into a price decision
Take the four points into a scenario model. Landed cost, current volume, and a volume assumption at each price. The share of respondents who rated a given price as good value or better is a rough but workable demand proxy.
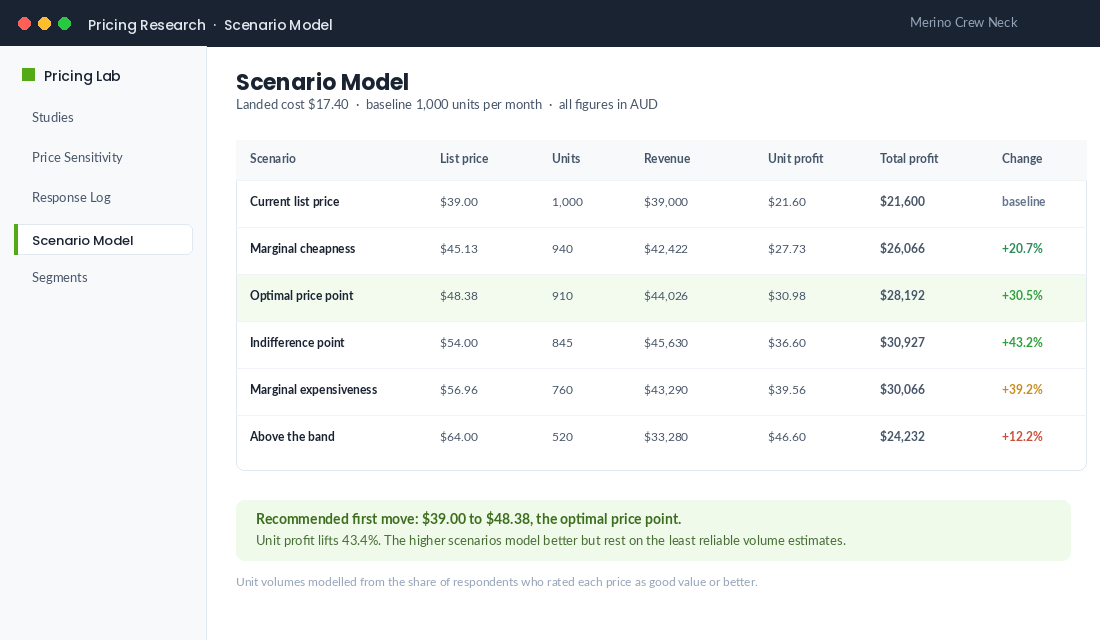
Two things usually fall out of this. The first is that the current price is below the floor, which means the first move is not a test at all, it is a correction. The second is that the highest modelled profit sits near the indifference point rather than the optimal point, because unit contribution climbs faster than volume falls.
Do not chase the top of the model on the first move. Volume estimates get less reliable the further you travel from where you have real trading data. Step to the optimal price point, hold it for a full purchase cycle, and measure what actually happened to units, add to cart rate, and refund rate. Then decide whether to take the next step.
Run the move properly. New price live across all channels on the same day, existing subscribers grandfathered or given notice, and a short line on the product page explaining what changed if the jump is large. Our Shopify price increase playbook walks through the sequencing and the customer comms.
Who Gives A Crap gave the market a live lesson in this during 2026, restructuring subscription pricing as input costs climbed. The lesson was less about the number and more about the telling. When the change is explained clearly and early, buyers absorb it. When it lands as a surprise in an inbox, it becomes the story instead of the product.
Where this fits in the wider pricing system
A price sensitivity study is one input, not a strategy. It sits between your cost structure and your positioning, and it is only as good as the two either side of it.
Before you run it, know your true unit economics. If you do not have an accurate landed cost including freight, duty, payment fees, and your real return rate, the scenario model is decoration. The contribution margin audit is the prerequisite.
After you run it, the band feeds your architecture: entry product, hero product, bundles, and the gap between them. A single optimal price for one SKU is useful. A coherent ladder across the range is what actually lifts average order value, which is the job of your pricing architecture.
Around 70% of Australian retail leaders now describe value-seeking behaviour as a structural shift rather than a temporary reaction to inflation. If that is right, price expectations will keep moving, and a study you ran once in 2026 will be stale by the middle of next year.
Make it a quarterly habit, not a one-off project
The compounding comes from repetition. Run the four questions on your hero product every quarter and you build a time series of what your market believes your product is worth. That series is more valuable than any single reading.
You start to see things that no dashboard shows you. The band drifting upward as your reviews and social proof accumulate. The band tightening as a competitor enters and buyers get a reference point. Buyers and non-buyers diverging, which tells you whether your pricing problem is actually a positioning problem.
It also changes the conversation internally. Instead of arguing about whether a price rise feels right, you are looking at a chart built from two hundred of your own customers. The four questions cost you three minutes of a customer’s time. The answer is worth more than most of the optimisation work sitting on your list this quarter.
After the Increase: The 30 Day Watch List That Tells You If You Got It Right
The survey gives you a band. The market gives you the answer. Most founders raise the price, feel nervous for a fortnight, then either panic and roll it back or forget to check at all.
Decide before you press publish which numbers you will watch and what result would make you reverse. Writing the reversal trigger down in advance is what stops one bad Tuesday from undoing a good decision.
- Conversion rate on the affected products, compared to the same weekday four weeks earlier, not to last week. Expect a 3 to 8% dip in the first fortnight while returning visitors re-anchor. A dip beyond 15% still running past week three is a real signal.
- Add-to-cart rate. If ATC holds and conversion falls, the objection sits at checkout (shipping cost, payment options), not at the price.
- Average order value and units per order. A rise that lifts AOV while units hold is the outcome you want. Units falling faster than the price rose means you went past the ceiling.
- Contribution margin per order in dollars, not percent. Percentages flatter a price rise. Dollars tell you whether the business is actually better off.
- Refund and return rate over 60 days. Higher prices raise expectations, and a return rate creeping up two months later is the delayed cost of pricing above perceived value.
- Support tickets mentioning price. Tag them. Under 2% of tickets is noise. Above 5% means the increase landed badly, and the messaging rather than the number is usually the problem.
Put the review in your calendar for day 30 before you change anything, and hold the line until then unless conversion falls more than 15%. Two weeks is not enough data on a store doing fewer than 400 orders a month, because a single quiet week will read as a disaster.
On communication: existing customers deserve notice, new customers need no explanation. A short email to repeat buyers two weeks ahead, with the real reason (input costs, freight, a genuine product improvement) and a window to buy at the old price, turns the increase into an urgency campaign instead of a grievance. Brands running that play often see a 20 to 40% lift across the notice period, which funds the softer weeks that follow.
Watch the margin flow through to your books too, because a price change moves every downstream number. The Shopify and Xero reconciliation system is where you confirm the lift is real rather than a rounding artefact.
The seven day price sensitivity sprint
Copy this into your project tool and run it on your hero product this month.
- Day 0. Confirm true landed cost per unit, including freight, duty, payment fees, and 12 month return rate.
- Day 1. Build the four question form. Open numeric fields only. Add the buyer screening question. Write a precise product description.
- Day 2. Build the segment of buyers from the last 12 months. Send to enough contacts to clear 200 completed responses. Non-discount incentive only.
- Day 3 to 5. Collect. Send one reminder at 48 hours.
- Day 5. Clean: remove straight-line answers and illogical orderings. Expect to lose 4% to 8%.
- Day 6. Plot the four cumulative curves. Record the floor, optimal point, indifference point, and ceiling.
- Day 7. Build the scenario model. Compare unit contribution and total contribution at each point against today.
- Day 8. Decide the first move. Default to the optimal price point unless the model is overwhelming.
- Day 30. Review units, add to cart rate, refund rate, and contribution against the pre-change baseline.
- Quarterly. Re-run on the same product. Track how the band moves.
If you cannot name the floor and the ceiling your customers gave you, you are not pricing. You are hoping.
Inside eCommerce Circle, pricing is one of the core pillars we work on with every member, and it is almost always the fastest profit win available. If you want a second opinion on where your prices should sit, let’s talk.