Every founder I sit down with has a number in their head. “The Australian beauty market is worth four billion dollars.” “Pet care is a five billion dollar category.” They say it like it settles the question. It does not settle anything, because none of that money is available to you.
What’s in This Article
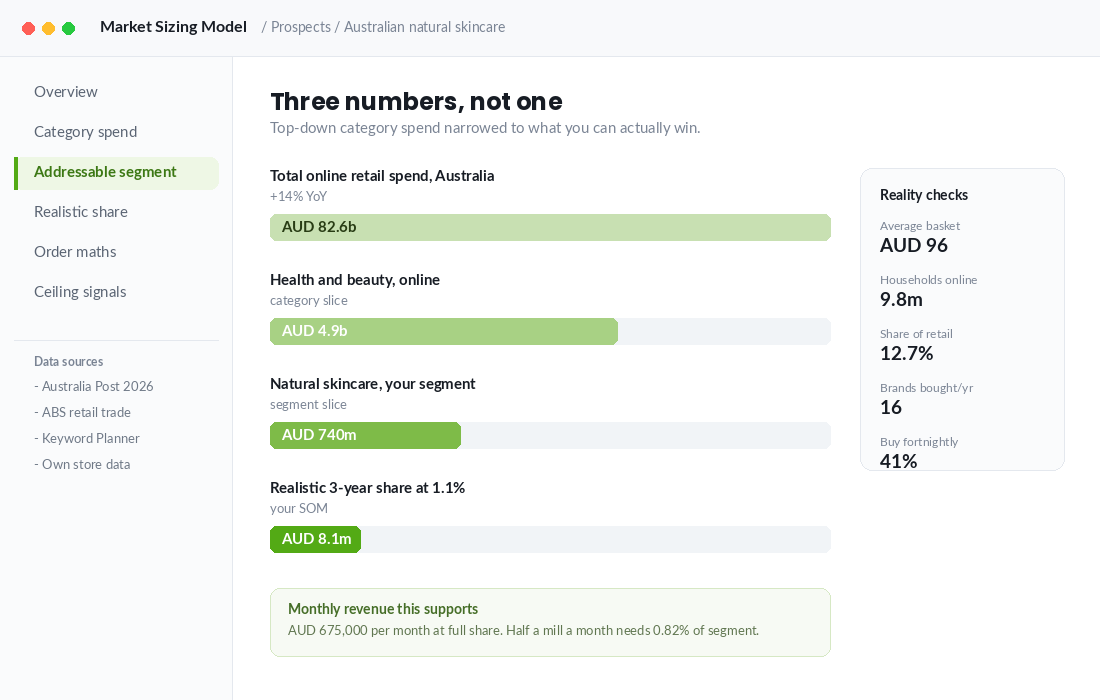
Here is the number that actually matters. Australians spent a record 82.6 billion dollars online in 2025, up 14% year on year, across 9.8 million households. That is 82% of all Australian households buying something online.
The average basket was 96 dollars. Those households now buy from an average of 16 different brands a year, and 41% of them shop online at least fortnightly.
Read those numbers again and you will see the real question. You do not need a bigger market. You need to know how many of those 16 brand slots your niche can realistically hand you, and whether that is enough to get you to half a mill a month. Most Aussie founders never do this maths, then spend two years wondering why paid spend stopped working at 180k a month.
The number most founders quote is the one they can never win
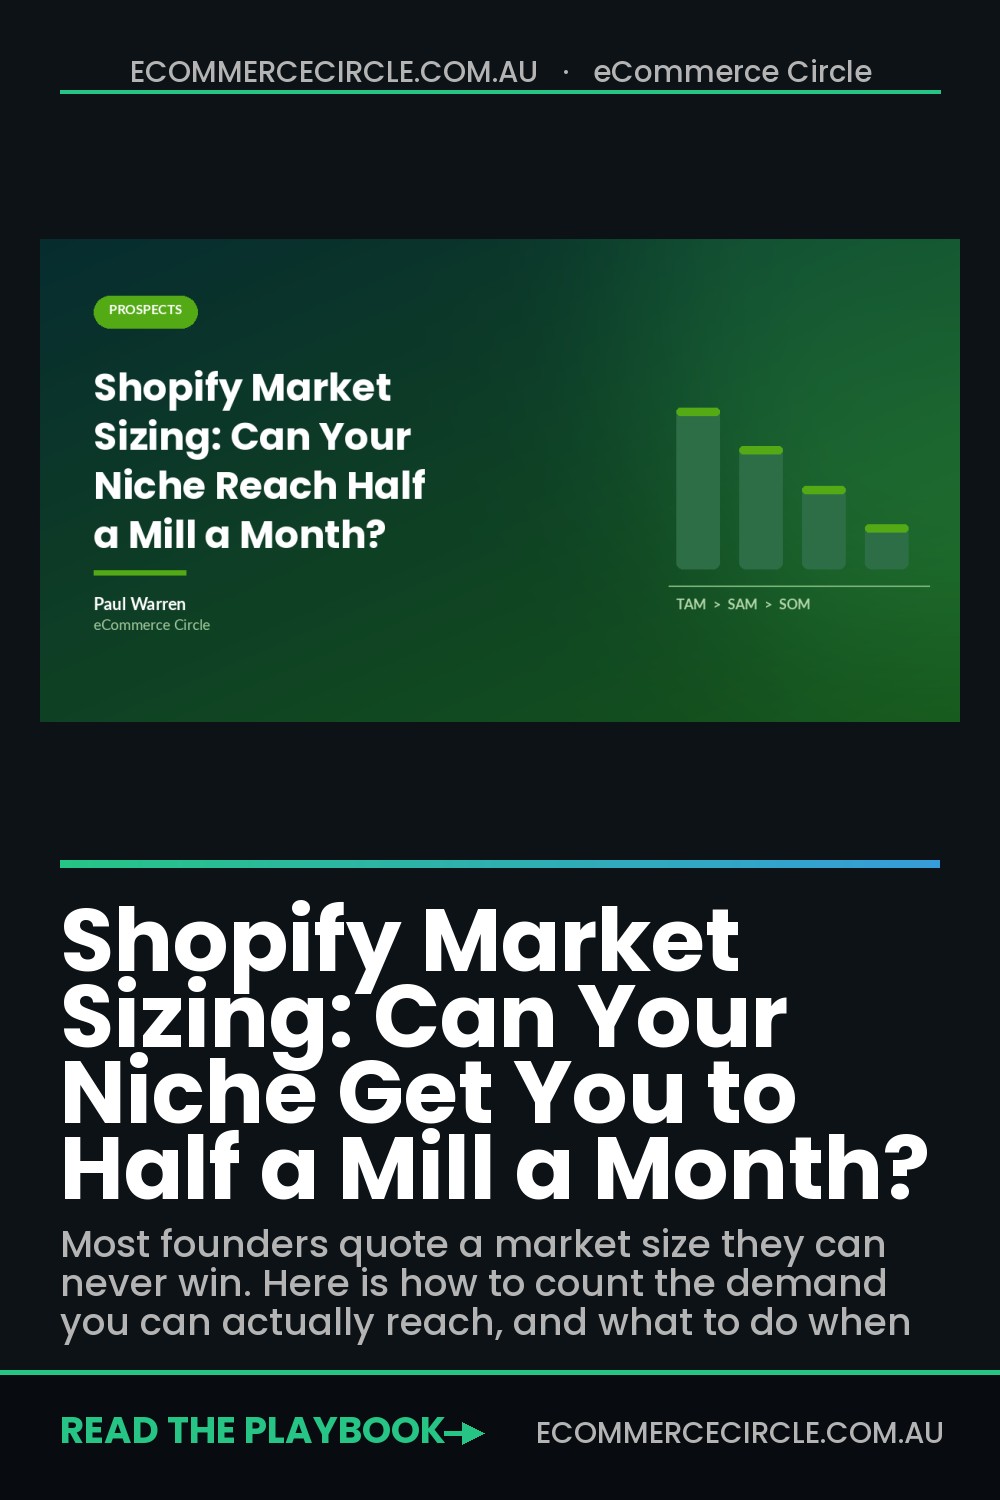
Market sizing has three layers, and founders almost always quote the top one because it is the biggest and it feels good in a pitch.
- Total addressable market. Everything spent in your broad category, online and offline, by everyone. Useless for planning. Nice for investor decks.
- Serviceable addressable market. The slice you could actually sell to given your product, your price point, your shipping footprint and your channel mix. This is the number that should drive your plan.
- Serviceable obtainable market. The share of that slice you can realistically hold in three years given who else is already there. This is the number that tells you whether your niche has a ceiling.
The gap between the first and the third is enormous. A brand quoting a four billion dollar category might be fighting over a 600 million dollar segment and can realistically hold about 1% of it inside three years. That is six million a year, or 500k a month. Suddenly the strategy conversation is completely different.
Step one: build the top-down number from real Australian data
Start with published spend, not vibes. The Australia Post eCommerce Report is the best free source we have for Australian online spend by category, and it is granular enough to work with.
From the 2026 edition, the big online categories break down roughly like this. Food and liquor sits at 16.0 billion dollars, up 14%. Fashion and apparel is 11.6 billion, up 11.5%.
Home and garden is 11.4 billion. Online marketplaces alone pulled 18.9 billion, up 13%, which is money flowing through Amazon, eBay and Catch rather than through brand-owned stores.
Growth rates matter more than absolute size when you are choosing where to push. Books, stationery and multimedia grew 24.1%. Department stores grew 19.5%.
Hobbies and recreational goods grew 17.1%. Consumer electronics grew 16%. Footwear grew 8.9%.
A category growing at 24% forgives a lot of operational sins. A category growing at 3% punishes every mistake.
Then narrow. Take your category figure and apply two honest filters:
- Price band filter. If you sell at 89 dollars and half the category volume sits under 30 dollars, you cannot count that half. Cut it.
- Channel filter. If 23% of category spend goes through marketplaces you do not sell on, cut that too, or model it as a separate channel with its own economics.
What is left is your serviceable addressable market. For most Aussie DTC brands this lands somewhere between 200 million and one billion dollars. Write the number down. You will test it in a minute.
Step two: build the bottom-up number by counting actual demand
Top-down numbers are always optimistic because they are built from someone else’s definitions. Bottom-up numbers are built from people typing things. They are smaller, uglier, and much more useful.
The method is simple. Count the monthly search volume for every term a buyer in your segment would realistically use. Not brand terms, not your own name, and not broad category terms that include people who will never buy from you. Then convert that demand into orders.

The conversion chain looks like this. Total non-brand searches in your segment, times your realistic click share, times your site conversion rate, equals orders per month from search. If your segment shows 57,900 searches a month, you win 22% of the clicks, and you convert at 2.4%, that is roughly 306 orders a month from organic and paid search combined.
At a 96 dollar average order value that is about 29k a month. Which tells you immediately that search alone will never get you to half a mill a month in that segment. You need paid social, retail, marketplaces, or a much higher average order value.
That is not a failure. That is the plan writing itself.
Do the same count for Meta. Open Ads Manager, build the audience you would actually target in Australia, and read the estimated audience size. If your realistic Australian audience is 900,000 people and you need 60,000 customers a year to hit your target, you are asking for a 6.7% penetration of that audience every single year.
Possible in some categories. Fantasy in most.
Step three: reconcile the two numbers and believe the smaller one
Now put the top-down and bottom-up numbers side by side. They will not match. That is the point.
If your top-down says the segment is worth 740 million dollars but your bottom-up says total measurable demand across search and social supports maybe 40 million of brand-owned online spend, one of two things is true. Either your top-down definition is too broad, or a large share of that category spend happens somewhere you are not playing, like supermarket shelves, pharmacy, or marketplaces.
Both are useful findings. The first means you need to re-cut the segment. The second means the growth path runs through a channel you have not opened yet. We cover the channel side of that decision in the category entry points playbook, which is about the moments people actually enter your category rather than the keywords they type.
Take the smaller number as your working figure. Planning off the bigger one is how brands end up with 18 months of inventory and a marketing budget built on a market that was never reachable.
Step four: convert the number into orders, because revenue lies
Revenue targets hide the operational reality. Order counts do not. Convert every market sizing figure into orders before you make a decision with it.
Half a mill a month at a 96 dollar average order value is 5,208 orders a month, or about 173 orders a day, every day. That is a pick and pack requirement, a support ticket volume, a returns rate, and a cash conversion cycle. It is also roughly 62,500 orders a year, which at a 38% repeat rate means you need close to 38,000 new customers a year.
Now the market sizing number becomes a hard test. Are there 38,000 people in your Australian segment every year who will buy from a brand like yours at your price? If the honest answer is no, then the constraint is not your ads, your creative, or your conversion rate. It is arithmetic.
The lever most founders miss here is average order value. Lifting your average order from 96 dollars to 145 dollars drops the order requirement from 5,208 a month to 3,448. That is 34% fewer customers for the same revenue, which is a far cheaper path than finding 34% more demand in a segment that does not have it. Run the contribution margin numbers before you decide which lever to pull.
The four signals that say you have hit the edge of your niche
You do not need to guess whether you are approaching the ceiling. Your own data tells you. Look for these four together, because any one on its own can be explained away.
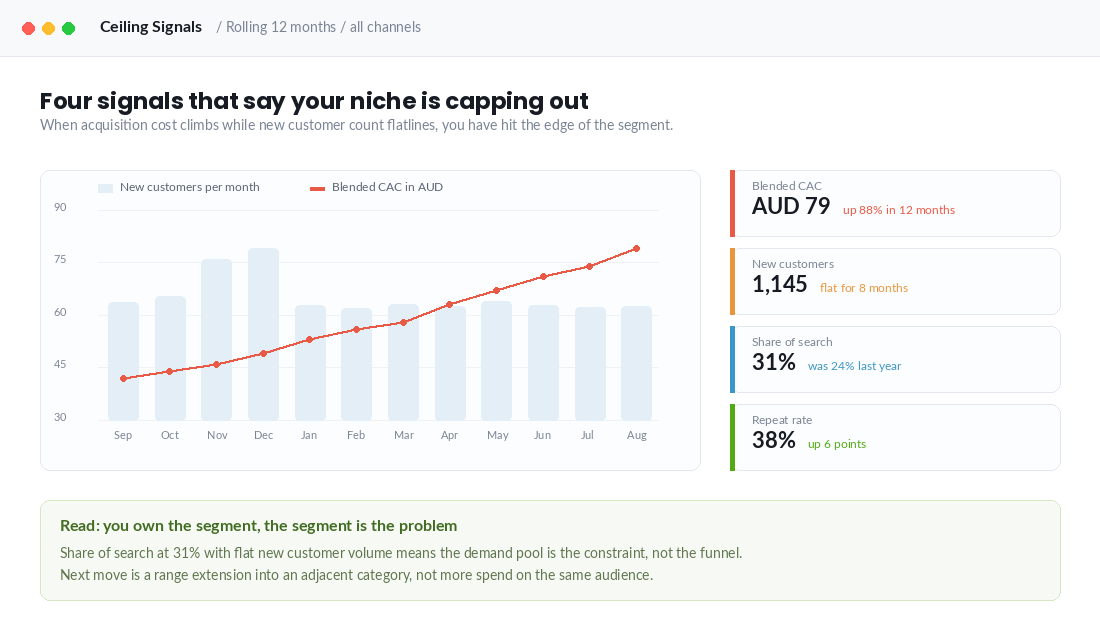
- Blended acquisition cost rising while new customer count is flat. This is the clearest signal. You are paying more to reach the same people. If CAC climbs 80% over twelve months while monthly new customers sit still, you are bidding against yourself inside a fixed pool.
- Share of search above 25 to 30%. If you already account for a third of the branded and non-branded search interest in your segment, there is very little left to take. Track this quarterly in Google Trends by comparing your brand term against the two or three category leaders.
- Repeat rate climbing while total revenue flattens. Your existing customers love you. There just are not enough new ones. This looks like a retention win on the dashboard and it is actually a demand warning.
- Prospecting audiences saturating inside two weeks. When a cold Meta audience hits 3x frequency in fourteen days, the audience is too small for your spend, not your creative.
How to run the demand count in Google Keyword Planner
Keyword Planner is free, it is Australian-specific, and it is still the fastest way to count segment demand. You need a Google Ads account, but you do not need to be running ads. Here is the exact sequence.
- Open Tools, then Planning, then Keyword Planner, then Discover new keywords. Set the location to Australia and the language to English. Do not leave it on the default worldwide setting or your numbers will be meaningless.
- Seed it with three to five competitor URLs, not keywords. Use the “Start with a website” tab and paste the collection page URL of a direct competitor. Google will return the terms it associates with that page, which is a much better seed list than the words you would have guessed.
- Set the date range to the last twelve months. This smooths seasonality. If your category is heavily seasonal, also pull the last 24 months so you can see whether the trend is real growth or just a good Christmas.
- Download to a spreadsheet and cut ruthlessly. Delete every branded term including your own, every term with obvious informational intent like “how to”, and every term outside your price band or product form. What remains is your countable segment demand.
- Sum the average monthly searches column and apply your click and conversion rates. Use 20 to 25% for click share if you rank on page one and run paid on the same terms, and use your actual site conversion rate rather than a benchmark.
Do this once a quarter and log the total. The direction of that number over four quarters is one of the most valuable pieces of intelligence in your business, and almost nobody tracks it. Pair it with a proper competitor analysis so you know whether the demand is growing or just moving between brands.
Three ways to lift the ceiling once you find it
Finding a ceiling is good news. It converts a vague growth problem into a specific strategic choice. There are only three real moves.
Deepen. Sell more to the same people. More products per order, more orders per year, higher price points. This is the cheapest move because you already own the relationship and you already paid for the customer.
Subscription, replenishment, bundles and a genuine premium tier all live here. If your repeat rate is under 30% you have not earned the right to consider the other two moves yet.
Widen. Sell the same product to a new segment. New age bracket, new use case, new geography. Shopify Markets makes the geographic version of this cheap to test, and New Zealand is usually the lowest friction first step for an Australian brand. We walk through the mechanics in the Shopify Markets playbook.
Extend. Sell a new product to the same people. This is the move Koala made. They built a business on mattresses, hit the natural limit of how many mattresses an Australian household buys, and extended into sofas, sofa beds and armchairs.
Their revenue reached 332.3 million dollars for the year ended 30 June, up 20% on a reported basis. The mattress category did not get bigger. Koala got wider inside the same customer relationship.
Who Gives A Crap is the opposite lesson and just as useful. Toilet paper is about as unglamorous and commoditised as a category gets, and they built a genuinely large business inside it by owning a values-led position rather than a product feature. They have now donated more than 12.5 million dollars to sanitation projects, which is both the mission and the moat. A boring category with a clear position beats an exciting category with none.
A Worked Example: Sizing a Niche Before You Commit Another Year to It
Imagine you run a Melbourne brand selling premium bamboo baby sleepwear, doing $38K a month. You want to know whether $500K a month is possible in this niche, or whether you need to widen the range.
Top-down. Around 290,000 babies are born in Australia each year, and children aged 0 to 2 wear sleepwear constantly, so call it roughly 870,000 kids in your core age band. If 30% of families buy premium sleepwear and spend $180 a year on it, that is a total market of about $47M a year.
Bottom-up. Google Keyword Planner shows about 22,000 monthly searches across “bamboo baby sleepwear”, “baby sleeping bag” and related terms. At a 3% conversion rate and an $85 AOV, capturing 25% of that search demand is about $140K a month from organic and paid search. Add social, marketplaces and repeat purchases and a realistic ceiling lands somewhere between $180K and $250K a month.
Reconcile. Both numbers say the same thing. $500K a month is not coming from bamboo sleepwear alone. That is not bad news. It tells you to either extend into adjacent categories, such as toddler pyjamas, swaddles and bedding, or to open New Zealand where the same customer exists with less competition.
The Tools That Make Market Sizing Faster
You do not need a research budget to do this well. A handful of free and cheap tools covers 90% of the work:
- Google Keyword Planner: free with any Google Ads account, and the best source for Australian search volume ranges.
- Google Trends: set to Australia, with a 5-year view, to spot whether the category is growing, flat or seasonal.
- ABS data: population, household and retail trade figures for top-down estimates.
- Semrush or Ahrefs: from around $140 USD a month, to see how much traffic the top three competitors actually get.
- Meta Ads Library: free, and a quick way to count how many brands are spending in your niche right now.
Revisit your numbers every six months. Search demand and competitor activity move faster than most founders expect. Our demand seasonality guide shows how to read Australian search trends month by month, and the range planning playbook covers how to extend your product line once you hit the ceiling.
The one-page market sizing worksheet
Copy this into a doc and fill it in this week. It takes about two hours if you already have Keyword Planner access, and it will change what you spend money on next quarter.
- Category spend, Australia, online. Source it from the Australia Post eCommerce Report. Write the figure and the year.
- Minus marketplace share. If you do not sell on Amazon, eBay or Catch, remove that portion or model it separately.
- Minus out-of-price-band volume. Estimate the share of the category selling below or above your band. Be pessimistic.
- Equals your serviceable addressable market. One number, in dollars.
- Countable search demand. Total non-brand monthly searches from Keyword Planner, Australia only.
- Countable social audience. Meta Ads Manager estimated Australian audience size for your real targeting.
- Realistic three-year share. Between 0.5% and 3% for most Australian DTC brands, depending on how concentrated the category already is.
- Serviceable obtainable market in dollars, then divided by twelve. That is your monthly revenue ceiling on current positioning.
- Divided by your average order value. That is your monthly order ceiling.
- Divided by your repeat rate. That is the number of new customers a year the plan requires. If that number scares you, the plan is wrong, not you.
Why this compounds
None of these steps is clever on its own. Any decent analyst can pull a keyword report. What compounds is doing all of them together, once a quarter, and letting the answer actually change your decisions.
Here is what happens over a year. Quarter one you discover your reachable segment is a third of the size you assumed. Quarter two you stop pouring budget into a saturated prospecting audience and put it into average order value instead, which drops your required customer count by a third.
Quarter three you launch one adjacent product to the customers you already have, because you now know extension is cheaper than acquisition in your category. Quarter four your acquisition cost stops climbing for the first time in eighteen months, because you are no longer fighting for the last 4% of a pool you already dominate.
Meanwhile the market keeps moving underneath you. Online is still only 12.7% of total Australian retail turnover according to the final ABS monthly print, and households are adding four extra online purchases a year. The demand is growing. The question is only ever whether it is growing in the specific patch of ground you have chosen to stand on.
Founders who know their real number make calmer decisions. They stop treating every flat month as a marketing failure, they stop hiring to fix a demand problem, and they extend their range twelve months before they need to rather than twelve months after.
Inside eCommerce Circle, market sizing is one of the first things we work through with every member, because almost every other decision sits downstream of it. If you want a second opinion on yours, let’s talk.