Walk into your 3PL, or out to the garage, and look at the pallets. Every carton on those shelves is cash you have already paid. Some of it will turn back into cash next week. Some of it will still be sitting there next Christmas.
What’s in This Article
Most Aussie Shopify founders judge their products on two numbers: revenue and gross margin. The 70% margin serum looks like a hero. The 45% margin tote bag looks like a problem. So you reorder the serum, squeeze the tote and move on. Then you wonder why the bank balance never matches the P&L.
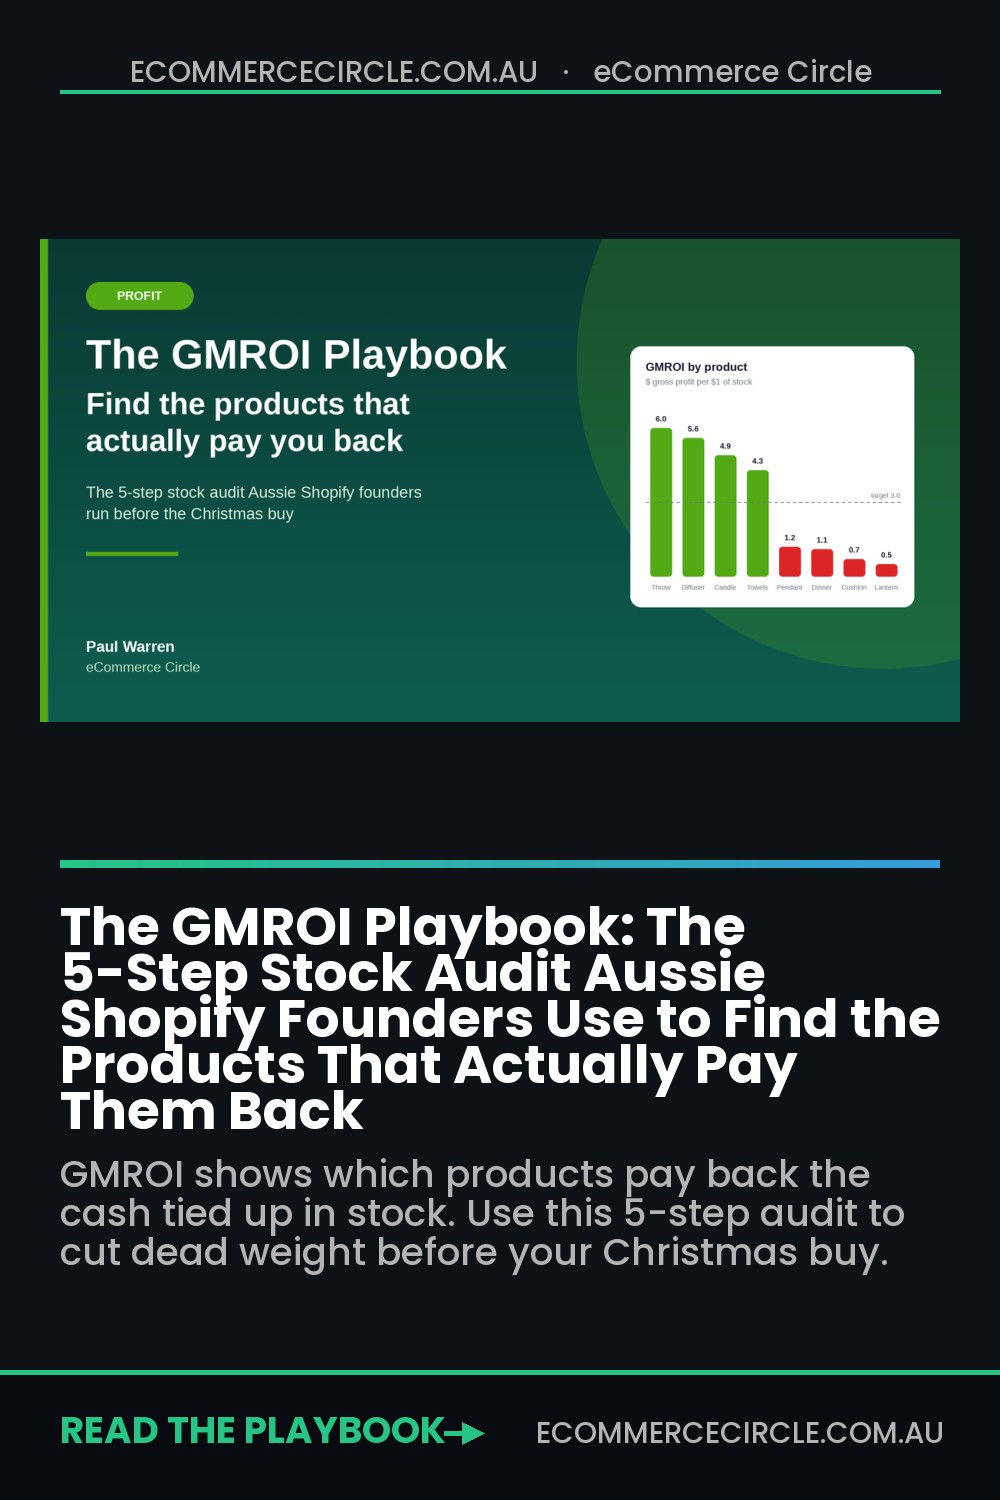
The brands that grow without constantly running short of cash judge stock differently. They ask one question of every SKU: for every dollar I tie up in this product, how many dollars of gross profit does it hand back each year? That number is called GMROI, and once you calculate it by SKU, it usually shows that 20% of your range is paying for the rest, and a chunk of your “best margin” products are quietly draining your cash.
This playbook walks you through a five-step GMROI audit you can run in one afternoon with Shopify’s built-in reports and a spreadsheet. Do it before you lock in your Christmas and January buy, and you will put your cash behind the products that actually pay you back.
Why Revenue and Margin Lie About Your Stock
Gross margin tells you how much you make when something sells. It tells you nothing about how long you waited or how much cash you parked to make that sale. A product with a 70% margin that sells through once a year can be a worse investment than a 45% margin product that sells through six times.
GMROI (gross margin return on inventory investment) puts both sides on the same page. The formula is simple:
GMROI = Gross profit ÷ Average inventory at cost
If a product earned $60,000 of gross profit over the last 12 months and you held an average of $20,000 of it at cost, its GMROI is 3.0. Every dollar sitting on the shelf generated three dollars of gross profit over the year. If another product earned $30,000 of gross profit but you held $40,000 of it on average, its GMROI is 0.75. You are earning less than a dollar back for every dollar you parked.
This is not a small-business quirk. The IHL Group’s 2025 research puts the global cost of inventory distortion at roughly US$1.7 trillion a year, with overstocks alone accounting for more than US$570 billion. Closer to home for independent brands, Netstock’s 2025 supply chain planning benchmark found that 55% of small and mid-sized businesses hold at least 20% excess stock, and 46% say 5% or more of their inventory is dead stock.
Excess stock is not free while it waits. The Institute for Supply Management benchmark cited by NetSuite puts annual carrying costs at 20% to 30% of average inventory value once you add the cost of capital, storage, insurance, handling and the risk of markdowns. On $300,000 of stock, that is $60,000 to $90,000 a year you never see on a single invoice.
And the cost of capital is climbing for Aussie founders. The Reserve Bank has already lifted the cash rate earlier in 2026, and markets are pricing in another rise at the 29 September meeting. If your stock is funded by an overdraft, a trade finance line or a revenue-based loan, every slow SKU just got more expensive to hold.
What a Good GMROI Looks Like (and the Two Levers Behind It)
A GMROI above 1.0 means the stock earned more gross profit than it cost to hold at cost value. Most retail guides call 2.0 to 3.0 healthy and anything above 3.0 strong. But the category matters a lot.
Shopify’s own analysis of US retailer filings shows how wide the range is. Using gross profit and average inventory from each company’s annual report, Abercrombie & Fitch runs a GMROI of about 6.1, scrubs brand FIGS about 3.5, Ulta Beauty about 2.4 and Best Buy about 1.8. Apparel brands with strong full-price sell-through sit at the top. Electronics, with thin margins and expensive stock, sit at the bottom.
For a DTC Shopify brand with product margins of 55% to 75%, I want to see a storewide GMROI of at least 3.0. Below 2.0, your stock is working too hard for too little.
Here is the part most founders never see. GMROI is driven by exactly two levers, and you can write it like this:
GMROI = Stock turns × (Gross margin % ÷ Cost %)
Stock turns is how many times a year you sell through your average inventory (cost of goods sold ÷ average inventory at cost). Cost % is simply 100% minus your margin. Run a few examples and the maths gets very clear:
- 60% margin, 1.5 turns a year: 1.5 × (60 ÷ 40) = GMROI of 2.25.
- 60% margin, 3 turns a year: 3 × (60 ÷ 40) = GMROI of 4.5. Same product, same price, double the return, just by holding half as much stock.
- 40% margin, 6 turns a year: 6 × (40 ÷ 60) = GMROI of 4.0. A “low margin” product that beats the first example comfortably.
- 75% margin, 0.8 turns a year: 0.8 × (75 ÷ 25) = GMROI of 2.4. The luxury hero that looks great on the P&L and ordinary on the balance sheet.
Costco is the extreme proof. Its gross margin is famously thin, but it turns its stock over roughly a dozen times a year. Its annual reports have stated for years that, because of high sales volume and rapid inventory turnover, it generally sells inventory before it has to pay many of its merchandise vendors. Its suppliers are effectively funding its stock. You will never run a 12-turn Shopify brand, but moving from 2 turns to 3 does the same thing on a smaller scale: it frees cash and it lifts GMROI without touching price.
Step 1: Pull the Right Data Out of Shopify
You do not need a new app to run this audit. You need clean cost data and three reports. Here is the exact setup.
First, fix your costs. GMROI is useless if your cost of goods is wrong. In Shopify admin, open each product and check the Cost per item field on every variant. Use your landed cost, not the factory price: product cost plus inbound freight, duty, customs brokerage and any packaging you add. If you have not worked out landed cost properly, fix that first, because a 10% error in cost flows straight into a 10% error in GMROI.
Then pull these reports from Analytics → Reports:
- Gross profit by product. Set the date range to the last 12 months. This gives you net sales, cost and gross profit for each product and variant.
- Inventory value (month-end snapshots). You need your inventory at cost at the start of each month. Shopify’s month-end inventory value and snapshot reports give you this. If you use a 3PL or an inventory system like Cin7, pull their monthly stock valuation instead, because it will be more accurate.
- ABC analysis by product, sell-through rate and days of inventory remaining. These built-in inventory reports look at the last 28 days, so they will not calculate GMROI for you. But they are the quickest way to sense-check your annual numbers against what is happening right now.
Export all three to CSV and drop them into one Google Sheet, one tab each. If you have hundreds of SKUs, do the audit at product level first and only go to variant level for your top 30 products. You are looking for the big leaks, not accounting perfection.
If you run a larger catalogue, an inventory planning app such as Prediko or Inventory Planner by Sage can calculate turns and forecast reorder points from your Shopify data. They are worth it past about 200 active SKUs. Below that, the spreadsheet is faster and you will learn more by building it yourself.
Step 2: Calculate GMROI and Turns for Every SKU
Now build one master tab. Each row is a product. Set up these columns:
- A: Product name
- B: Net sales (12 months)
- C: Cost of goods sold (12 months)
- D: Gross profit = B − C
- E: Gross margin % = D ÷ B
- F: Average inventory at cost = the sum of the 12 month-start values plus the final month-end value, divided by 13
- G: Stock turns = C ÷ F
- H: GMROI = D ÷ F
- I: Share of total inventory $ = F ÷ total of column F
- J: Share of total gross profit = D ÷ total of column D
Columns I and J are where the story jumps out. Sort by column I. In almost every store we audit, there are three or four products holding 10% or more of the inventory dollars each while producing a fraction of that share of gross profit. Those are your cash traps, and you would never find them by looking at revenue.
Two rules keep the numbers honest:
- Exclude products launched in the last 90 days. A new product with a full initial buy will always look terrible. Judge it on sell-through against plan instead.
- Use full-price and discounted sales together. If a product only moves at 30% off, the discounted margin is its real margin. GMROI should reflect that.
Step 3: Sort Every Product Into Four Buckets
A list of GMROI numbers does not tell you what to do. A simple four-box grid does. Plot every product on two axes: gross margin % across the bottom and stock turns up the side. Use your storewide averages as the dividing lines.
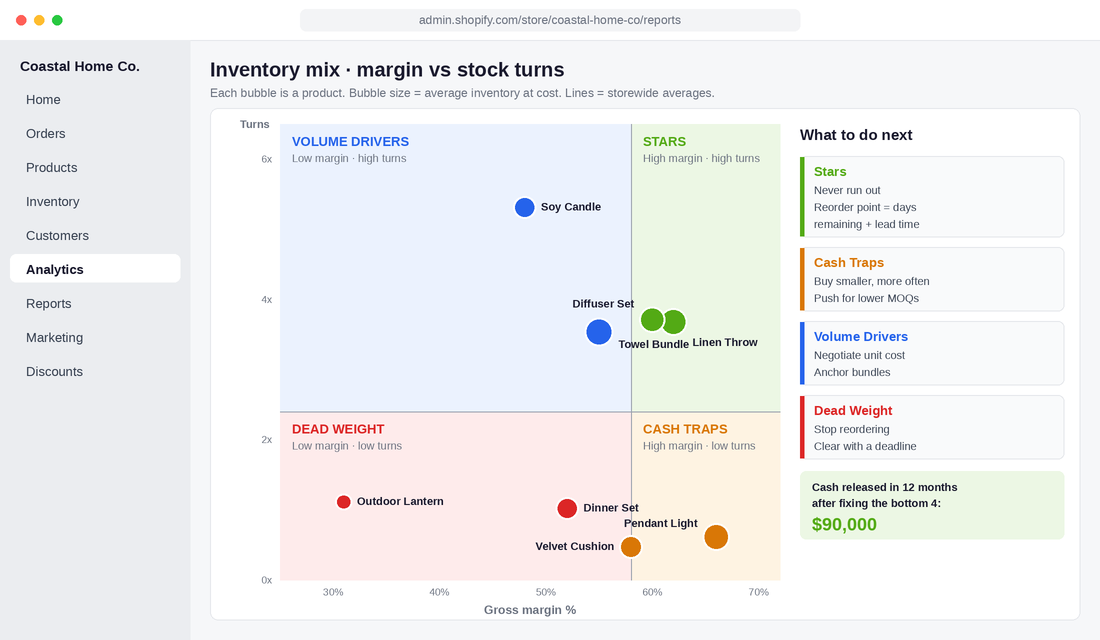
Stars (high margin, high turns). These are the products paying for the business. Your job is to never run out. Set reorder points using days of inventory remaining plus your supplier lead time, and give them the best placement on your homepage and in your ad spend.
Cash Traps (high margin, low turns). The most dangerous bucket, because the margin makes them look healthy. The fix is almost never a discount. It is buying less, more often. Cut the next purchase order quantity, push for a smaller MOQ even if the unit cost rises a little, and test whether the product sells better bundled with a Star.
Volume Drivers (low margin, high turns). These move fast but hand back little per sale. They are often your entry products and they matter for acquisition. Work the margin side: negotiate unit cost, lift the price in small steps, or use them as the anchor in a bundle that carries a higher-margin add-on.
Dead Weight (low margin, low turns). Every dollar here is a dollar that could be sitting in a Star. Stop reordering, set a clearance plan with a deadline, and free the cash. We cover the exact markdown ladder and liquidation options in the dead stock playbook.
A quick sanity check before you act: look at why each product sits where it does. A Cash Trap caused by one oversized opening order is a buying problem. A Cash Trap caused by weak demand is a product problem. The fix is different.
Step 4: Pull the Five Levers That Actually Move GMROI
Once you know which bucket each product sits in, the fixes are practical and mostly free. Work through these in order, because the first two cost you nothing.
Lever 1: Buy smaller, more often. This is the biggest lever and it does not touch margin at all. If you order six months of a product in one hit, your average inventory is roughly three months of sales. Order every two months and it drops to about one month. Turns triple, GMROI triples. The trade-off is a slightly higher unit cost and more freight admin, so run the numbers, but for slow and mid movers it almost always wins.
Lever 2: Negotiate terms, not just price. Moving a supplier from payment on order to 30 or 60 days after shipment does not change GMROI on paper, but it changes who funds the stock. Ask for split deposits, lower MOQs on slow colours, or the right to hold finished stock at their warehouse and call it off monthly. Costco’s model works because its suppliers fund the shelf. You can borrow a small piece of that.
Lever 3: Rationalise variants. Most Cash Traps are one product with too many sizes and colours. If 3 of 12 colourways drive 80% of sales, the other 9 are tying up cash for choice nobody uses. Cut the tail and buy deeper in the winners.
Lever 4: Price the Stars properly. Products with high turns and strong reviews usually have pricing power. A 5% price rise on a Star with a 60% margin lifts gross profit per unit by more than 8%, and GMROI moves with it. Test it on one hero product first.
Lever 5: Clear Dead Weight early, not late. Stock does not get easier to sell with age. A 20% markdown in October beats a 50% markdown in March, and the cash you free up can go into Stars before peak season.
Nike is the cautionary tale for ignoring this. In the quarter to August 2022, its inventory jumped 44% to US$9.7 billion as delayed shipments landed on top of slowing demand. Management flagged aggressive markdowns to clear it, and gross margin fell 220 basis points to 44.3% in that quarter alone. Nike had the brand, the data and the team. It still paid for stock that arrived faster than it could sell. For a $3m Shopify brand, the same mistake does not dent the margin. It empties the bank account in January.
Step 5: Put GMROI Guardrails on Every Purchase Order
An audit you run once fixes last year. Guardrails fix next year. The goal is to make GMROI part of how every purchase order gets approved, especially the big pre-Christmas and January buys that set your cash position for the whole first half of 2027.
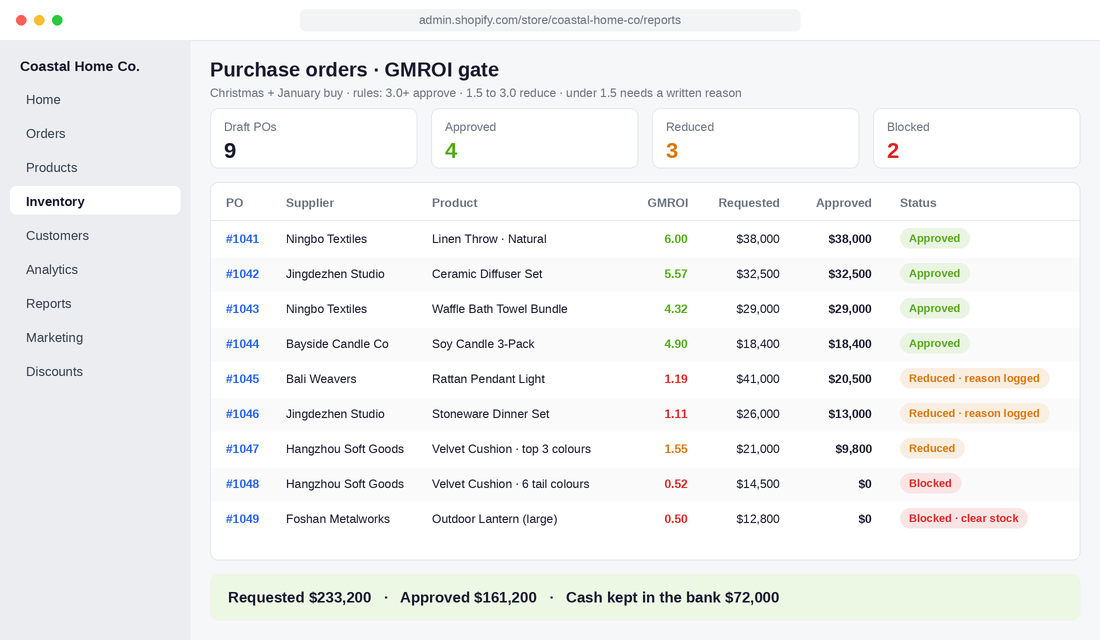
Here are the rules we set with brands we coach. Adjust the thresholds to your category, but keep the structure:
- GMROI above 3.0: reorder approved. Protect stock depth through peak and check days of inventory remaining weekly.
- GMROI 1.5 to 3.0: reorder approved at a reduced quantity. Cover sales until the next order point plus lead time, nothing more.
- GMROI below 1.5: no reorder without a written reason, such as a range-defining product or a planned campaign, signed off by the founder.
- GMROI below 1.0 for two quarters in a row: move to clearance. No exceptions.
Pair these rules with a monthly buying budget. Your open-to-buy plan sets how much you can spend on stock each month. GMROI decides where that money goes. Together they stop the two classic mistakes: buying too much overall, and buying the wrong mix.
Then put it on a rhythm. Recalculate GMROI by product once a quarter, 30 minutes after month-end close. Review the four-box grid with whoever places your orders. If a product moves buckets, the buying plan changes with it.
A Worked Example: Same Revenue, Ninety Grand More Cash
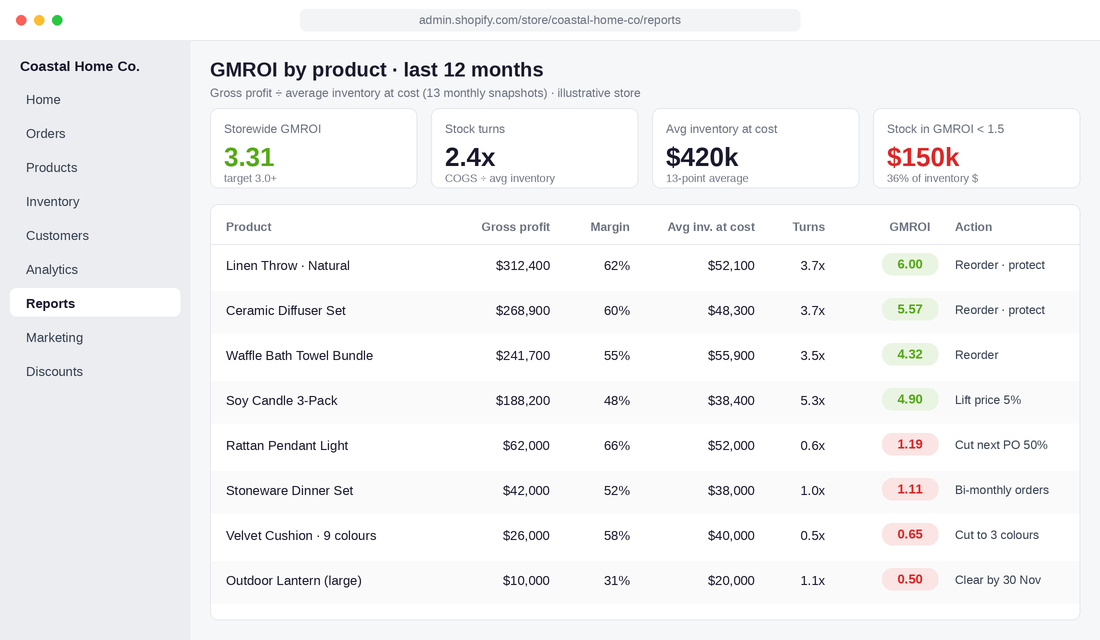
Let’s make this concrete with an illustrative Aussie homewares brand doing $2.4m a year in revenue at a 58% gross margin. That is about $1.39m of gross profit and $1.01m of cost of goods. It holds an average of $420,000 of stock at cost.
- Stock turns: $1.01m ÷ $420k = 2.4 turns a year.
- GMROI: $1.39m ÷ $420k = 3.3.
Healthy on the surface. But the SKU audit shows four products holding $150,000 of that stock (36% of the inventory dollars) while producing only $140,000 of gross profit (10% of the total). Their combined GMROI is 0.93. The rest of the range runs at about 4.6.
The founder takes three actions. She clears the two worst products over eight weeks at an average 25% markdown. She halves the order quantity on the other two and moves them to bi-monthly orders. She moves the freed-up buying budget into the three Stars that ran out of stock twice last year.
Twelve months later, revenue is flat at $2.4m, margin has dipped slightly to 57% because of the clearance, and average inventory is down to $330,000. That is $90,000 of cash released from the shelves. Storewide GMROI has lifted from 3.3 to about 4.1. And with a 25% carrying cost, she is saving roughly $22,000 a year in the cost of holding stock she did not need. Same brand, same customers, same ad spend. More cash, less risk.
That released cash has somewhere to go. It funds the next product launch, the peak season ad budget, or a buffer that means a slow January is an inconvenience instead of a crisis. If you want to see how stock days fit into your full cash cycle, the cash conversion cycle playbook shows how inventory, receivables and supplier terms work together.
The Mistakes That Make GMROI Useless
GMROI is a sharp tool, but it cuts the wrong way if you feed it bad inputs. Watch for these:
- Using factory cost instead of landed cost. Your margin looks better than it is and every GMROI number is inflated.
- Averaging only two balance sheet dates. Seasonal products look far more efficient than they are. Use monthly snapshots.
- Judging new launches on 12-month GMROI. Give new products 90 days and judge them on sell-through against plan.
- Cutting products that drive first orders. A low-GMROI entry product that brings in customers who go on to buy Stars might be worth keeping. Check your first-order product report before you kill anything.
- Chasing GMROI with deep stock cuts on Stars. Running out of a hero product in December costs far more than the carrying cost you saved. Protect the Stars and cut everywhere else.
- Ignoring the contribution below gross profit. A product with a great GMROI that is expensive to ship or often returned may still lose money per order. Cross-check against your contribution margin.
Your GMROI Audit Checklist
Print this or copy it into your task manager. Most founders can finish it in one focused afternoon.
Data (60 minutes)
- Landed cost entered in the Cost per item field for every active variant.
- Gross profit by product report exported for the last 12 months.
- 13 monthly inventory-at-cost snapshots pulled from Shopify, your 3PL or your inventory system.
- Products launched in the last 90 days flagged and excluded.
Analysis (60 minutes)
- Gross profit, margin %, average inventory, turns and GMROI calculated for every product.
- Share of inventory $ and share of gross profit compared side by side.
- Every product placed in Stars, Cash Traps, Volume Drivers or Dead Weight.
- Root cause noted for each Cash Trap: buying problem or demand problem.
Action (60 minutes)
- Reorder points set for every Star using days of inventory remaining plus lead time.
- Next purchase order quantity cut on every Cash Trap.
- Supplier conversations booked on MOQs and payment terms.
- Clearance plan with an end date set for every Dead Weight product.
- GMROI thresholds written into your purchase order approval process.
- Quarterly GMROI review booked in the calendar.
Score yourself out of 14. Under 8 means you are buying stock on gut feel, and your cash is paying for it.
The Compound Effect: Every Dollar of Stock Pulling Its Weight
Here is how the pieces work as a system. Clean landed costs make your margin numbers true. Monthly snapshots make your inventory numbers true. GMROI by SKU shows you where the cash is stuck. The four-box grid tells you what to do about it. And the purchase order guardrails stop the same mistakes from coming back next season.
Each step feeds the next. Released cash from Dead Weight funds deeper stock in Stars. Deeper Stars mean fewer stockouts in peak season, which means more full-price sales, which lifts margin. Smaller, more frequent orders on Cash Traps lift turns, which lifts GMROI again. Better numbers give you a stronger case with your bank or lender when you need funding. After two or three quarters, you are running the same brand on less stock, with more cash in the account and fewer 2am worries about the January supplier invoice.
Inside eCommerce Circle, profit is one of the core pillars we work on with every member, and inventory is usually where the biggest pile of hidden cash is sitting. If you want to see exactly where your store is being capped, take the free More Orders Scorecard. It takes two minutes and shows you which of the 10 P’s to fix first.