A typical Meta ads CPM for an Australian Shopify store sits somewhere between A$10 and A$28 per 1,000 impressions, depending on which benchmark you trust, and sales-objective campaigns land at the top of that range. The number that matters is your own CPM against your own cost per purchase, because a high CPM is only a problem when it drags your profit with it.
What’s in This Article
Most founders get this wrong in one of two ways. They see a CPM of $30 in Ads Manager, read a blog post saying Australia averages $10, and conclude the account is broken. Or they chase the lowest CPM they can find and end up buying cheap impressions that never turn into orders. Both mistakes come from treating CPM as a score instead of one input into a cost-per-purchase equation.
This guide gives you the real Australian benchmarks (and why they disagree), the formula that connects CPM to profit, the five levers that move your CPM, when prices spike in the Australian calendar, and a one-page CPM Decision Table you can copy into your weekly review. If you want the profit side first, start with our Meta ads ROAS benchmark for Australia and the Meta ads budget guide, then come back here.
What Australian Stores Actually Pay Per 1,000 Impressions
CPM stands for cost per mille, which is the price of 1,000 ad impressions. Meta sets it in an auction, so it moves every day with competition, your creative quality and who you are trying to reach. There is no single official Australian CPM. Every public number comes from a different sample of accounts, a different window and sometimes a different currency.
Here is what the recent public benchmarks say. I have listed them side by side because the gap between them is the most useful thing to understand:
| Source | Australian CPM | What it covers |
|---|---|---|
| Superads | $14.38 median, $9.63 to $21.73 range | July 2025 to July 2026. Currency not specified on the page. |
| Lebesgue | US$11.63 (roughly A$17) | 2026 ecommerce benchmark. The US sits at US$16.08 and the UK at US$11.81 in the same table. |
| Canty Digital | $9.80 | Blended average across industries and placements, quoted alongside a $1.47 average click cost. |
| Pace Ads | A$22 to A$35 for sales campaigns | Working planning ranges from account experience, not a measured market average. Reach campaigns are quoted at A$9 to A$14. |
Read that table properly and a pattern appears. The low numbers (around $10 to $14) are blended across every objective, including cheap awareness and engagement campaigns. The high numbers (A$22 to A$35) are for sales campaigns specifically, which compete for the most valuable buyers. If you run a Shopify store optimising for purchases, your CPM will almost always sit nearer the top of the range than the headline averages suggest.
That is why a CPM of A$25 to A$30 on a conversions campaign is normal, not a red flag. And it is why you should never judge your account against a blended number from a blog post, including this one. Use the table to sense-check that you are in the right postcode, then measure yourself against your own history.
One more useful reference point. WordStream’s Australian data for Q1 2026, as reported by Rocking Web, puts retail and ecommerce at a $1.20 cost per click and a 1.31% click-through rate, against $1.47 and 1.11% for all industries. Retail CPCs tend to run cheaper than average because purchase decisions are small and audiences are broad. That detail matters in the next section.
Why CPM Is the Wrong Number to Judge an Account On
You do not pay your bills in impressions. You pay them in purchases. CPM only becomes a cost per purchase after it passes through two filters: how many people click, and how many of those clicks buy. Put those together and you get the formula that should sit above every CPM conversation:
Cost per purchase = CPM ÷ (1,000 × link click-through rate × site conversion rate)
Run the numbers on three accounts. Account A has a cheap $14 CPM but a weak ad that earns a 0.8% link CTR, and the site converts at 2.5%. That is 8 clicks per 1,000 views and 0.2 purchases, so each purchase costs $70.00. Account B pays $26 per 1,000 views, 86% more than Account A, but its ad earns a 1.9% CTR. That is 19 clicks and 0.475 purchases per 1,000 views, so each purchase costs $54.74. The more expensive CPM wins.
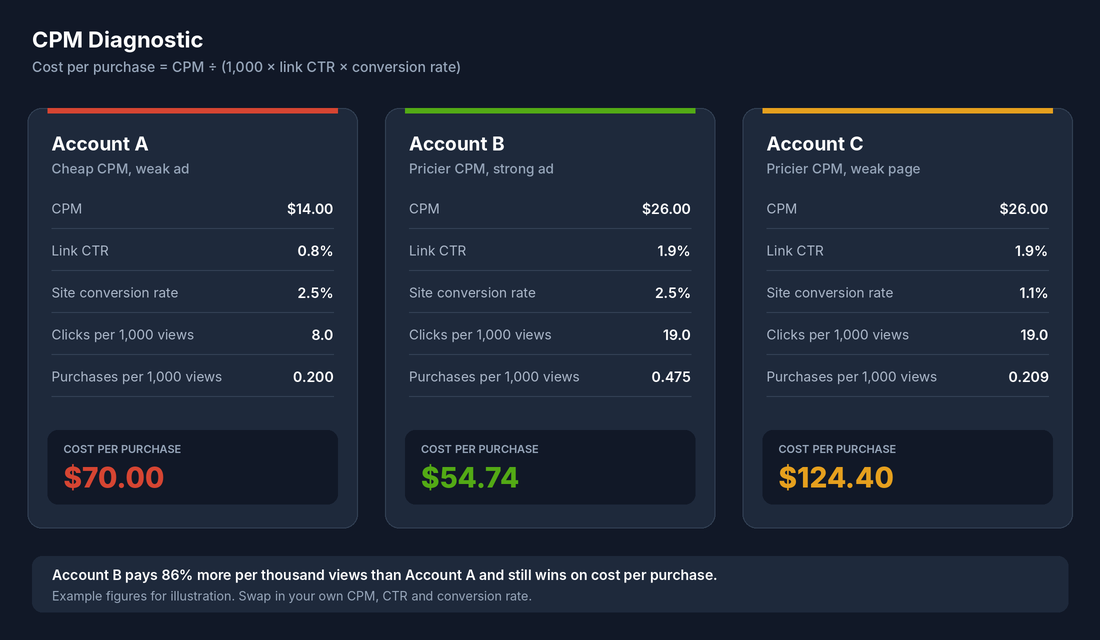
Account C is the quiet killer. Same $26 CPM and same strong ad as Account B, but the site converts at 1.1% instead of 2.5%. Cost per purchase jumps to $124.40. Nothing is wrong with the auction. The leak is on the page.
This is why your first question when CPM rises should never be “how do I get it down?” It should be “what happened to CTR and conversion rate at the same time?” If CTR climbed with CPM, you may be reaching better buyers and paying a fair premium. If CTR collapsed, you have a creative problem. If both held and conversion rate dropped, you have a site problem. We cover the full triage in our guide to Meta ads not converting.
The 5 Levers That Move Your CPM
You cannot control the auction, but you control more of your CPM than most founders realise. These are the five inputs that change what you pay, in the order I would check them.
Lever 1: Placement mix
Different placements carry different prices. Feed placements tend to carry the highest CPMs, and Reels is often 20% to 30% cheaper, according to the Canty Digital guide. Blended Australian data points the same way: one benchmark source lists Instagram Feed at $11.40 and Instagram Reels at $6.20 against a $9.80 blended average.
The trap is optimising for the cheap placement. In the example account below, Audience Network has the lowest CPM at $10.00 and the worst result: 2 purchases at $305.00 each. Instagram Reels at a CPM of $18.96 delivered purchases at $66.35. Always look at cost per purchase by placement before you cut or favour anything.
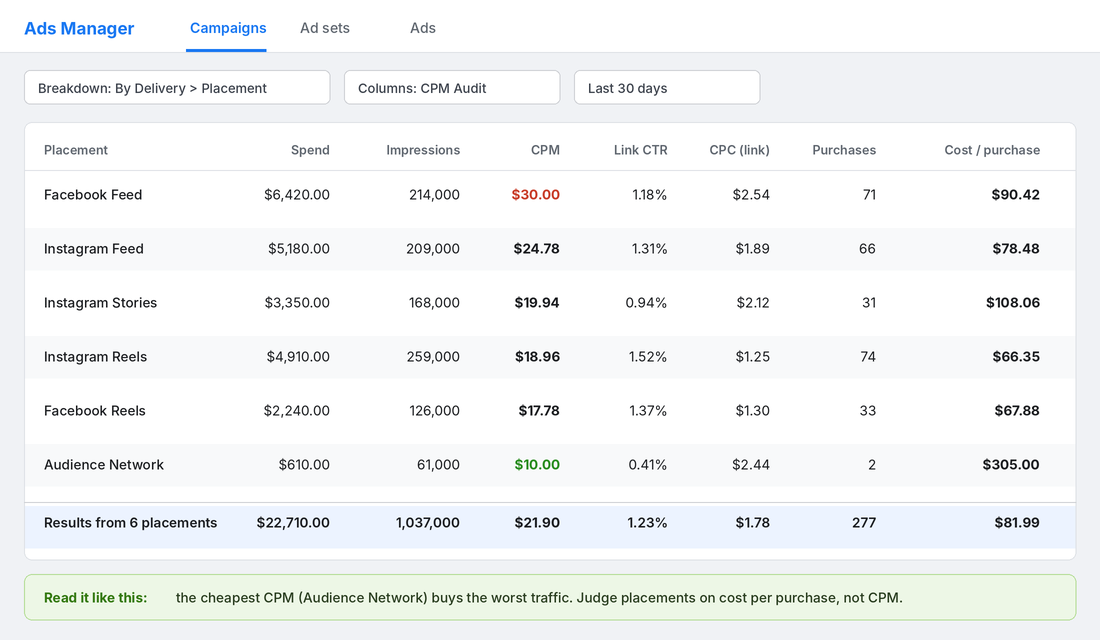
My default is to leave Advantage+ placements on and only exclude a placement once it has spent at least 2 to 3 times your target cost per purchase with no sales. Anything less is noise.
Lever 2: Audience size and overlap
Very narrow audiences force Meta to compete harder inside a small pool, and overlapping ad sets compete against each other in the same auction. You end up bidding against yourself and paying for the privilege. If you run six prospecting ad sets with near-identical interests, consolidate them. Fewer, broader ad sets give Meta room to find cheaper pockets of buyers and exit the learning phase faster. Our Meta ads budget guide walks through the structure.
Lever 3: Creative quality and variety
Meta predicts how likely each person is to engage with each ad before it decides what to charge. Ads people want to watch win auctions more cheaply. That is why creative is now the biggest CPM lever you own. Since Meta’s Andromeda update, the system also rewards clearly different concepts over small variations of the same ad, which we unpack in Meta Andromeda for Shopify ad creative. If your five ads are the same product shot with five different headlines, Meta sees one ad.
The evidence for volume is encouraging. Nest Commerce analysed more than 40 major ecommerce brands with over £100 million in combined Meta spend and reported that brands running two to three times more creative than the year before saw CPM fall 16% and cost per acquisition fall 14% over Black Friday weekend. That is an agency analysis, reported by eCommerceNews Australia, so treat it as direction rather than a guarantee. But it matches what we see: more distinct creative means more chances to win cheap auctions.
Lever 4: Frequency and ad fatigue
When the same people see the same ad again and again, engagement falls and CPM creeps up. The tell is a steady CPM climb alongside a falling CTR on an ad that used to perform. The fix is a fresh concept, not a bigger budget. Set a calendar reminder to review frequency on your top three ads every Monday, and replace any ad where frequency is above 3 on prospecting while CTR has dropped by a third from its peak.
Lever 5: Seasonal competition
This is the one you cannot fix, only plan for. Ad inventory is fixed, and when more advertisers arrive in the same weeks everyone pays more. That is the next section.
When Australian CPMs Spike (and When They Drop)
The Superads data gives a clean view of how Australian CPMs moved over 13 months. The median was $14.38. November 2025 hit the peak at $21.73, about 51% above the median. December then fell to $10.86, about 24% below it. The softest month in the data was May 2026 at $9.63, and the same source shows a second spike in April.
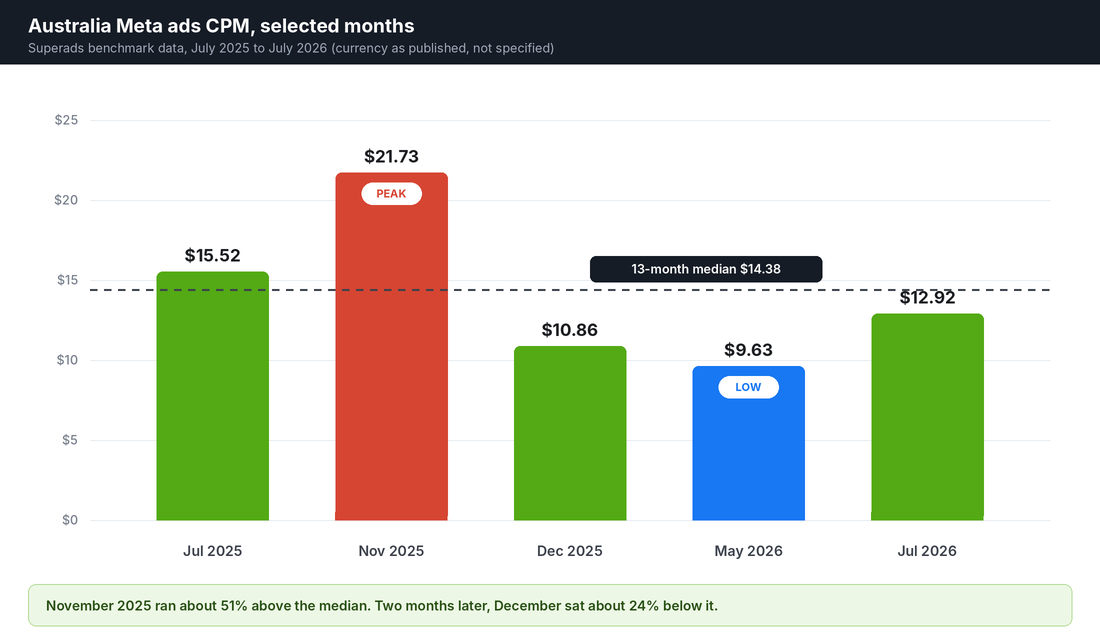
Notice what that pattern means for your calendar. The cheapest windows for testing new creative and building audiences are the quiet months, and the most expensive windows are the ones where you most want to sell. Canty Digital lists the other Australian pressure points as end of financial year in June, back-to-school in late January, and regional events. Treat those as predictable CPM spikes you budget for, not surprises you react to.
What happens on Black Friday
Lebesgue tracked about $22.6 million of Meta spend from September to November 2025 across its biggest spenders. The median brand paid 59% more per thousand impressions in Black Friday week than in September, and 84% more on Black Friday itself. Here is the part most people miss: the same median brand’s cost per purchase fell 20%, because conversion rate rose 48% as buyers arrived with intent.
Category mattered too. In the same data, home and decor CPMs rose 116% in Black Friday week, electronics and sporting goods 76%, fashion and footwear 66%, and beauty, health and supplements 42%. Those are small groups, not market-wide benchmarks, but they tell you the spike is not evenly shared. The timing also moved year on year: the first week at least 10% above September arrived on 14 October in 2024 and 10 November in 2025.
The lesson is not to run from expensive CPMs in November. It is to plan the budget around them and to make sure your offer and landing page convert, because that is where cost per purchase gets won. We built the full budget ramp and freeze list in Meta ads for Black Friday: budget and timing plan, and the dates are in Black Friday Australia 2026.
How Aussie Brands Keep Cost Per Purchase Healthy at Any CPM
Public Australian case studies rarely publish CPM, and the ones that exist are agency-reported, so I will be clear about what each one does and does not show. Still, two of them make the same point from different angles.
Sharkskin, a premium Australian water sports brand, worked with Australian Internet Advertising and moved from generic summer sale messaging to themed, urgency-driven promotions. According to the agency’s case study, October delivered $172,739 in sales on $54,787 of ad spend, a 3.15 blended ROAS. The Halloween sale returned a 3.67 ROAS against 2.25 for the Summer sale. The case study does not report CPM, but the takeaway is clear: a sharper offer lifted the return without any change to the auction.
Aussie Candle Supplies, an Australian candle-making supplier, used catalogue ads inside retargeting to drive the largest share of its purchase volume, alongside AI-generated static creative tests. The agency reports 1,530 purchases in a single month at a $2.87 cost per result (the page does not name the month). Its CPM is not reported either, and a result that low reflects a very low-priced, high-volume offer. The useful lesson is structural: retargeting with a catalogue is a cheap way to turn the traffic your prospecting CPM already paid for into orders. See the full case study for the details.
Neither brand won by finding a cheaper auction. They won by making each impression more likely to turn into a sale: a stronger offer, better creative and a retargeting layer that catches what prospecting misses. That is the same lesson as Account B in the diagnostic above.
Tool: Build a CPM Audit View in Meta Ads Manager (10 Minutes)
You do not need a paid tool to audit CPM properly. Meta Ads Manager can show every number in this guide on one screen if you save a custom column preset. Do this once and reuse it every week.
- Open Ads Manager and go to the Campaigns tab. Set the date range to the last 30 days.
- Click Columns, then Customise columns. Add Amount spent, Impressions, CPM (cost per 1,000 impressions), CTR (link click-through rate), CPC (cost per link click), Purchases and Cost per purchase.
- Save the preset as “CPM Audit” so it is one click next time.
- Click Breakdown, then By Delivery, then Placement. This shows the placement table from the screenshot above for your own account.
- Repeat with Breakdown, then By Time, then Week to see your CPM trend and spot the weeks it jumped.
- Paste both views into a sheet once a month and add your own median CPM. That becomes your personal benchmark, which is far more useful than any blog post.
The goal is a single row of numbers you can compare week to week: CPM, CTR, conversion rate and cost per purchase. When one moves, the Decision Table below tells you where to look.
The CPM Decision Table (Copy This Into Your Weekly Review)
Every week, pull the same four numbers for your top prospecting campaign: CPM, link CTR, site conversion rate and cost per purchase. Then match what moved to the likely cause:
| What moved | Likely cause | What to do |
|---|---|---|
| CPM up, CTR down | Creative fatigue or weak concepts | Ship 2 to 3 clearly different new concepts. Pause ads with frequency above 3 and falling CTR. |
| CPM up, CTR steady, cost per purchase steady | Seasonal competition | Do nothing. Budget for it and protect your offer. Do not cut spend that is still profitable. |
| CPM up, CTR steady, cost per purchase up | Seasonal competition plus a weaker page or offer | Audit the landing page and offer before touching targeting. |
| CPM steady, CTR steady, conversion rate down | Site, price or stock problem | Check page speed, stock, shipping thresholds and checkout. This is a Platform problem, not an ads problem. |
| CPM down, cost per purchase up | Cheap, low-intent placements or audiences | Check the placement breakdown. Exclude only after real spend with no sales. |
| CPM high from the start of a new ad set | Narrow audience or overlap | Consolidate ad sets and widen targeting. |
Three rules sit on top of the table. First, never edit an ad set in response to one day of data, because that resets learning and makes CPM worse. Second, change one thing at a time so you know what worked. Third, set your break-even cost per purchase before you look at CPM at all. If cost per purchase is under break-even, a high CPM is just the price of growth.
The Compound Effect: CPM Is a Symptom, Not a Strategy
Look at how the pieces fit. Creative variety lowers the price Meta charges you to reach buyers. Consolidated ad sets stop you bidding against yourself. A strong offer and a fast, trusted site raise the share of clicks that become orders. Retargeting catches the buyers prospecting already paid to find. And a calendar that expects the November spike stops you from panicking and resetting learning at the worst moment.
None of that requires a lower CPM. Stack it and your cost per purchase falls even when your CPM rises, which is exactly what the Lebesgue data shows in Black Friday week. The stores that win on Meta are not the ones with the cheapest impressions. They are the ones where every impression is more likely to become a customer.
Your CPM Checklist for This Week
- Save the “CPM Audit” column preset in Ads Manager and pull the last 30 days.
- Calculate your own median CPM and write it down as your personal benchmark.
- Work out your break-even cost per purchase (average order value multiplied by gross margin).
- Check cost per purchase by placement and note any placement that is cheap on CPM but expensive on sales.
- Count your active prospecting ad sets and consolidate any that overlap.
- Check frequency and CTR trend on your top three ads and brief replacements for any that are fading.
- Mark the Australian CPM pressure points on your calendar: late January, April, June (EOFY), and November to December.
- Run the Decision Table every Monday for the next four weeks before you change a single setting.
Inside eCommerce Circle, paid media performance is one of the core pillars we work on with every member. If you want to see exactly where your store is being capped, take the free More Orders Scorecard. It takes two minutes and shows you which of the 10 P’s to fix first.