Most Shopify founders set their Meta ads budget the same way. They pick a round number like $100 a day, run it for a fortnight, panic when the ROAS looks soft, and either slash the spend or double it on a hunch. Neither move is based on anything.
What’s in This Article
The brands that scale Meta profitably do it backwards. They work out what a customer is worth, what they can afford to pay to get one, and how many purchases the algorithm needs to learn. The budget falls out of that maths. It is never a guess.
This guide gives you that maths in AUD. You will get the break-even formula, the minimum daily budget per ad set, benchmark ranges by store size, a budget split, a scaling ladder you can run every three days, and a one-page Budget Decision Framework to copy. If you want the account structure that sits underneath it, start with our guide to Meta ads account structure, then come back here.
Why Your Meta Ads Budget Is Not a Round Number
A budget is a bet on how many purchases you can buy at a price that leaves you profit. That makes three numbers matter: your gross margin, your average order value, and the cost of one purchase on Meta. Everything else is noise.
Meta also has a rule that most budget advice ignores. Each ad set needs roughly 50 optimisation events in a 7 day window to exit the learning phase, according to the guidance summarised by AdManage. If your budget is too thin to deliver that, the ad set sits in “Learning Limited”, delivery turns erratic, and your cost per purchase climbs. That is how a good ad gets killed by a bad budget.
There is a market-level reason to get this right too. Triple Whale tracked more than 33,000 brands and $18.4 billion in ad spend and found Meta took 68.3% of ad spend in 2025 (Triple Whale 2025 benchmarks). When most of your competitors are bidding in the same auctions, a vague budget is an expensive one.
Step 1: Find Your Break-Even Cost Per Purchase
Start with what one order earns before ads. Take your average order value, multiply it by your gross margin, and you have your break-even cost per purchase. Pay more than that to acquire a customer and that first order loses money.
Break-even CPA = Average order value x Gross margin %. Break-even ROAS = 1 / Gross margin %.
Here is a worked example for an Aussie homewares store. The average order is $85 and the gross margin after product cost, packaging and shipping subsidy is 55%.
- Gross profit per order: $85 x 0.55 = $46.75. That is your break-even CPA.
- Break-even ROAS: 1 / 0.55 = 1.82. Below that, every Meta sale costs you money.
- Target CPA: aim 30 to 40% below break-even to leave room for overheads and profit. At 35% below, the target is about $30.
Gross margin is the figure most founders overstate. Include payment fees, pick and pack, and returns, or your break-even will be fiction. The contribution margin guide walks through how to strip a store down to true contribution margin, and the marginal ROAS playbook explains why marginal ROAS matters more than the blended number on your dashboard.
One more benchmark to keep in mind. Common Thread Collective, a US agency that publishes its efficiency framework, puts blended break-even at roughly a 2.0 aMER for a brand with 70% gross margins, and notes that lower margins need a higher return (Common Thread Collective). Your own margin sets your own line.
Step 2: Work Out the Learning Phase Floor
Now convert that target CPA into a minimum daily budget. The formula is simple.
Minimum daily budget per ad set = (Target CPA x 50) / 7.
At a $30 target CPA, one ad set needs $1,500 a week to buy 50 purchases. That is about $214 a day, or roughly $6,430 a month. At a $20 CPA it drops to $143 a day. At $50 it climbs to $357. The screenshot below shows the same calculation laid out as a planner.
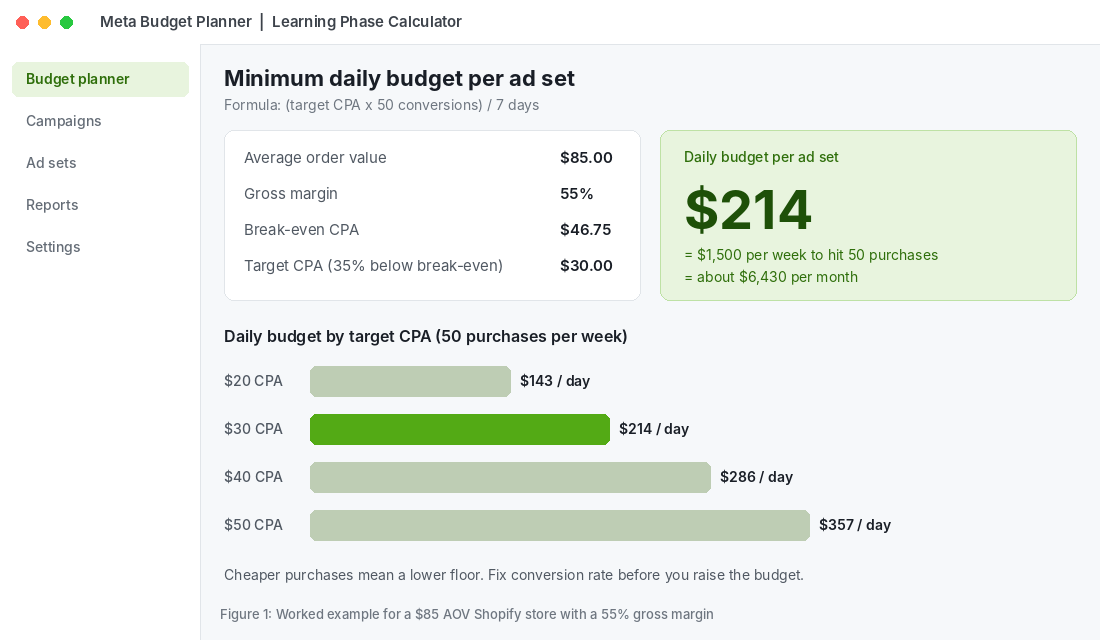
The lesson is the part founders skip. Your floor is set by your CPA, and your CPA is set by your conversion rate and creative. A store that lifts its conversion rate from 1.5% to 2.5% lowers its CPA, which lowers the budget it needs, which makes scaling cheaper. Fix the page before you raise the spend.
What if you cannot afford $214 a day?
Most stores under $30,000 a month cannot. You have three honest options:
- Run one campaign with one ad set. Never split a thin budget across five ad sets. Five ad sets at $40 each means five ad sets stuck in learning.
- Optimise for a higher funnel event for a short window. Add to cart gives the algorithm more signal, but accept it is a weaker proxy for sales and move back to purchase as soon as volume allows.
- Raise your AOV or conversion rate first. A free shipping threshold or a bundle can move CPA more than any budget change.
Meta can also exit learning on fewer events in practice, and its guidance is not a hard law. Treat 50 as the target, not a cliff.
Step 3: Sanity-Check Against Revenue Benchmarks
Your bottom-up number needs a top-down check. Eightx publishes ad spend as a share of revenue by stage, and the ranges are wide because margins differ by category. Stores earning $1M to $5M in annual revenue typically spend 20 to 30% of revenue on advertising. At $5M to $10M the range is 15 to 25%, and at $10M to $25M it is 12 to 20% (Eightx 2026 stage benchmarks).
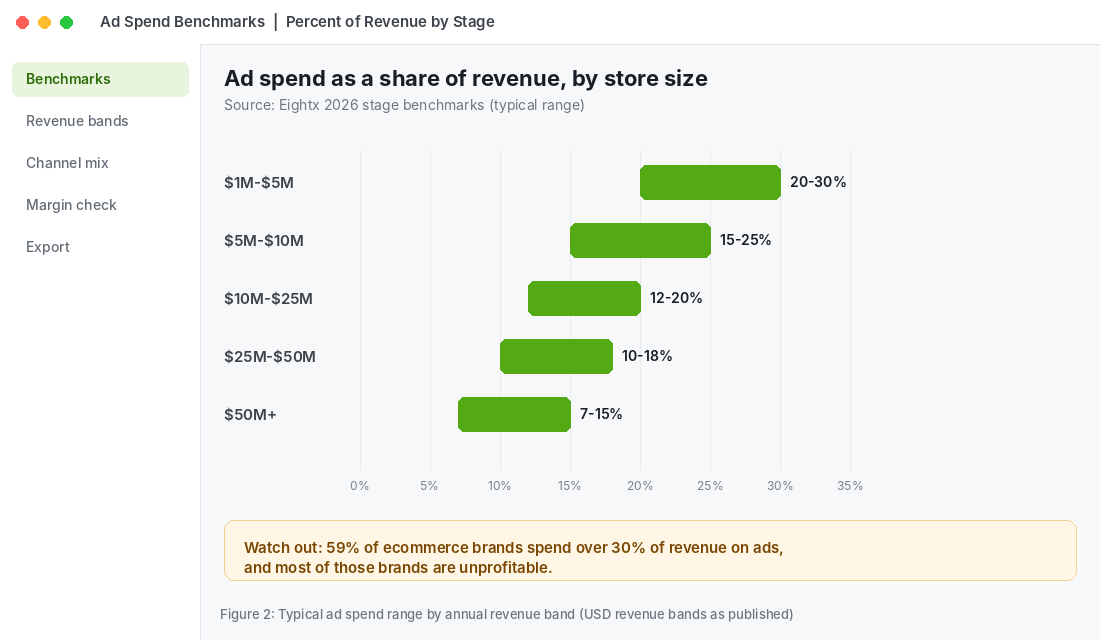
The warning in that data matters more than the ranges. Eightx reports that 59% of ecommerce brands spend more than 30% of revenue on ads, and most of those brands are unprofitable. High spend is not a growth strategy when the margin cannot carry it.
Use the benchmark as a ceiling check. In the homewares example, $6,430 of ad spend at 25% of revenue implies about $25,700 a month in total sales. If your store does $12,000 a month, spending $6,430 on Meta is not a learning-phase decision, it is a cash flow problem.
| Annual revenue band | Typical ad spend (% of revenue) | What it usually means |
|---|---|---|
| Under $1M | 25 to 35% | Paying to find product-market fit. Watch cash closely. |
| $1M to $5M | 20 to 30% | Growth mode. Margin must support it. |
| $5M to $10M | 15 to 25% | Repeat purchase should start carrying the load. |
| $10M to $25M | 12 to 20% | Retention and email do more of the work. |
| $25M and above | 7 to 18% | Brand and repeat revenue lower paid dependency. |
Source: Eightx 2026 benchmarks, USD revenue bands as published. Your Australian numbers will shift with margin and category, so use the range as a guardrail, not a target.
What Meta Actually Costs You in Australia
Your budget has to buy impressions at a real price. Superads data puts the Australian median CPM at about 14 dollars per thousand impressions across July 2025 to July 2026, with retail and ecommerce often sitting at the higher end of a $5 to $18 range (Superads). Superads does not state the currency, so check your own account before you plan around it.
Two cost pressures are worth building into your plan:
- Costs are rising. Triple Whale data cited by Trackbee shows Meta costs rose roughly 20% into 2025, so last year’s CPA is a poor guide to this year’s.
- BFCM is a different market. CPMs reach two to three times the annual baseline during Black Friday and Cyber Monday, according to Gupta Media. A budget that works in September will buy about half the reach in late November.
Plan your peak season budget from the maths in this article, then use our BFCM target maths guide to set the revenue target the spend has to support.
Step 4: Split the Budget Between Prospecting and Retargeting
Once you have a total, you need to decide where it goes. This is our coaching rule of thumb rather than a published benchmark, so test it against your own data.
- 70 to 80% on prospecting. Cold audiences or broad targeting with Advantage+ campaigns. This is where growth comes from.
- 10 to 20% on retargeting. Cart abandoners, product viewers and engaged audiences. It converts cheaply, but the audience is small and saturates fast.
- 5 to 10% on testing. A separate campaign for new creative and offers, so winners graduate into the main campaign without disrupting it.
The mistake we see most is over-funding retargeting because its ROAS looks great. That ROAS is flattered by people who were already coming back. If you want a cleaner view of what retargeting really adds, the geo-holdout incrementality guide explains how to test it properly.
Creative is the lever that decides whether your budget works. Brands that win on Meta keep a steady flow of new ads in testing. Adligator’s analysis of Gymshark found 7,369 ads on its page, with its best creatives running 135 to 147 days while the library kept refreshing (Adligator). The spend figures in that piece are estimates, not disclosures, so read it as a picture of creative discipline rather than a budget to copy. Our 3-layer creative testing framework shows how to run that testing without burning your whole budget.
Step 5: Scale With the 20% Ladder
Budget increases are where good campaigns get wrecked. Large jumps in budget often reset learning, and the commonly cited threshold is an increase of around 20% at once (an industry rule of thumb, not an official Meta number). So do not double your budget on a Monday because the weekend looked good.
Use a ladder instead:
- Review every three days, not daily. Meta results need time to settle and daily changes are mostly noise.
- Raise the budget by 20% or less only if blended MER holds at or above your target.
- Hold if MER slips slightly. Do not touch creative and budget in the same review.
- Roll back to the last stable budget if MER falls 15% or more, then retest.
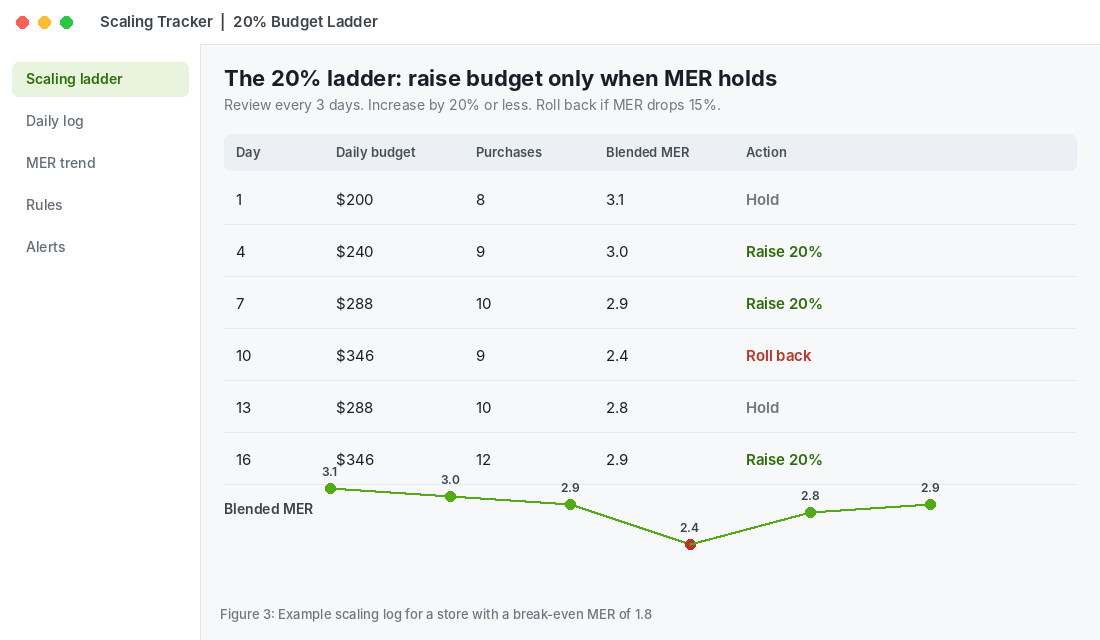
Track blended MER (total revenue divided by total ad spend) alongside platform ROAS. Platform ROAS can look healthy while the business is not, because attribution overlaps. MER cannot lie to you, because it is just your revenue and your spend.
Four Budget Mistakes We See in Aussie Stores
- Budgeting from your bank balance. “I can afford $50 a day” is a cash decision, not a media decision. If $50 a day cannot buy 50 purchases a week at your CPA, plan for slower learning or fix the offer first.
- Judging a campaign after 48 hours. Early numbers swing wildly. Give each change at least three days and a full conversion window before you call it.
- Changing everything at once. New creative, new audience and a bigger budget in one edit means you will never know what worked. Change one lever per review.
- Ignoring cash timing. You pay Meta now and Shopify pays you in a few days. A fast scale-up can leave you short on stock and ad spend at the same time, so check your cash runway before every budget step.
Most of these come from the same root cause: treating the budget as a feeling instead of a formula. The framework further down fixes that.
A Real Example: Spending Because Margin Allows It
Australian retail gives a useful contrast to the “spend more” instinct. Kogan.com reported FY26 revenue of $425.2 million, up 16.2%, with gross margin lifting 0.8 points to 43.5%. Inside Retail reported that the efficiency gains gave it room to reinvest in marketing (Inside Retail). The sequence is the point: margin and efficiency came first, then the marketing budget followed. The article does not disclose Kogan’s marketing spend, so there is no number to copy, only the order of operations.
Your version of that sequence is simple. Improve margin and conversion first. Raise the budget second. Brands that do it the other way round end up in the 59% spending over 30% of revenue and losing money.
The Tool Setup: Make Sure Meta Sees Your Sales
A budget is only as good as the data steering it. If Meta cannot see your purchases, it cannot optimise, and your CPA will look worse than it is. Here is the setup we check first. For the deeper version, see our server-side tracking playbook.
- In Shopify, open Sales channels and install the Facebook & Instagram app, then connect your Business portfolio, Facebook page, ad account and pixel.
- Set data sharing to the Maximum level so the Conversions API sends server-side events alongside the browser pixel.
- In Meta Events Manager, open your pixel and check the Purchase event shows both Browser and Server sources, with a high event match quality score.
- Create a simple sheet with four columns: date, revenue, ad spend, MER. Update it every three days and use it for the scaling ladder above.
- Optional: a dashboard tool such as Triple Whale shows blended MER and new customer CAC automatically, which saves the manual sheet once you are spending consistently.
Do the Purchase event check before you change a single budget. If server events are missing, fix that first and give the numbers a week to settle.
How the Pieces Work as One System
Each step above looks small on its own. Together they stop the two budget mistakes that sink most stores: spending too little to learn and spending too much to profit.
- Break-even CPA tells you the most you can pay for a customer.
- The learning floor tells you the least you need to spend to let Meta find them.
- The revenue benchmark tells you whether your total is realistic for your stage.
- The split keeps the money working on new customers, not recycling old ones.
- The ladder lets you grow without resetting the algorithm.
Skip any one and the system leaks. Run all five and your budget becomes a decision you can defend with numbers, not a number you hope works.
The Meta Ads Budget Decision Framework (Copy This)
Paste this into a doc or sheet and fill it in once a month:
| Step | What to calculate | Your number |
|---|---|---|
| 1. Break-even CPA | AOV x gross margin % | $______ |
| 2. Target CPA | Break-even minus 30 to 40% | $______ |
| 3. Daily floor per ad set | (Target CPA x 50) / 7 | $______ / day |
| 4. Monthly ceiling | Revenue x benchmark % for your band | $______ / month |
| 5. Budget split | 70-80% prospecting, 10-20% retargeting, 5-10% testing | ___ / ___ / ___ |
| 6. Scaling rule | +20% every 3 days if MER holds, roll back at -15% | MER target: ____ |
| 7. Tracking check | Purchase event shows Browser and Server | Yes / No |
If step 3 is higher than step 4, you do not have a budget problem. You have a margin or conversion problem, and that is where to spend your next week.
Where to Go From Here
Inside eCommerce Circle, Meta budget setting is one of the core Promotion skills we work on with every member, because the right number depends on margin, offer and creative together. If you want to see exactly where your store is being capped, take the free More Orders Scorecard. It takes two minutes, costs nothing and shows you which of the 10 P’s to fix first.