Most Australian Shopify stores pay between $1 and $4 a click on Google, and the figure that matters is not the click price. It is the highest click price your margin and conversion rate can carry. If your average CPC sits above that ceiling, you lose money on every first order, no matter how good the ads look.
What’s in This Article
That is the gap in most of what you read on this topic. Agencies quote a blended Australian average, a store owner compares it to their own account, and neither of them knows whether the number is good. A $2.50 click is cheap for a store with a 4% conversion rate and a 60% margin. It is a slow bleed for a store converting at 1% on a 35% margin.
This guide gives you the real benchmark ranges (with the sources and their limits), the five things that move your CPC, the difference in cost between Shopping, Search and Performance Max, and a simple calculator that turns your margin into a maximum CPC you can hold your account to. If you want the spend side of the equation, our Google Ads budget guide covers how much to put in. This one covers what each click will cost you once it is in.
What Google Ads Actually Costs in Australia
There is no single official Australian CPC for ecommerce, and anyone who gives you one number is guessing. The published ranges come from agency data and benchmark reports, and they disagree. That disagreement is useful, because it shows you the realistic band.
- Webics puts the Google Search average across all Australian industries at about $3.81 a click, and ecommerce and retail at $2 to $4.
- DigitalZoop lists Australian eCommerce at $1.00 to $3.50 a click with a cost per acquisition of $20 to $80, and says most Australian businesses pay $1.50 to $6.00 across all industries.
- Shopiator, which publishes benchmarks from its own managed ecommerce accounts (several countries, not Australia only), reports average CPCs of $1.92 for Search, $1.53 for Performance Max and $1.32 for Google Shopping in its 2026 update.
- WordStream by LocaliQ measured an all-industry average CPC of about US$5.42 in 2025, up from US$4.66 in 2024, with costs rising in 87% of industries. That is a US dataset across every vertical, so treat it as a direction of travel, not your target.
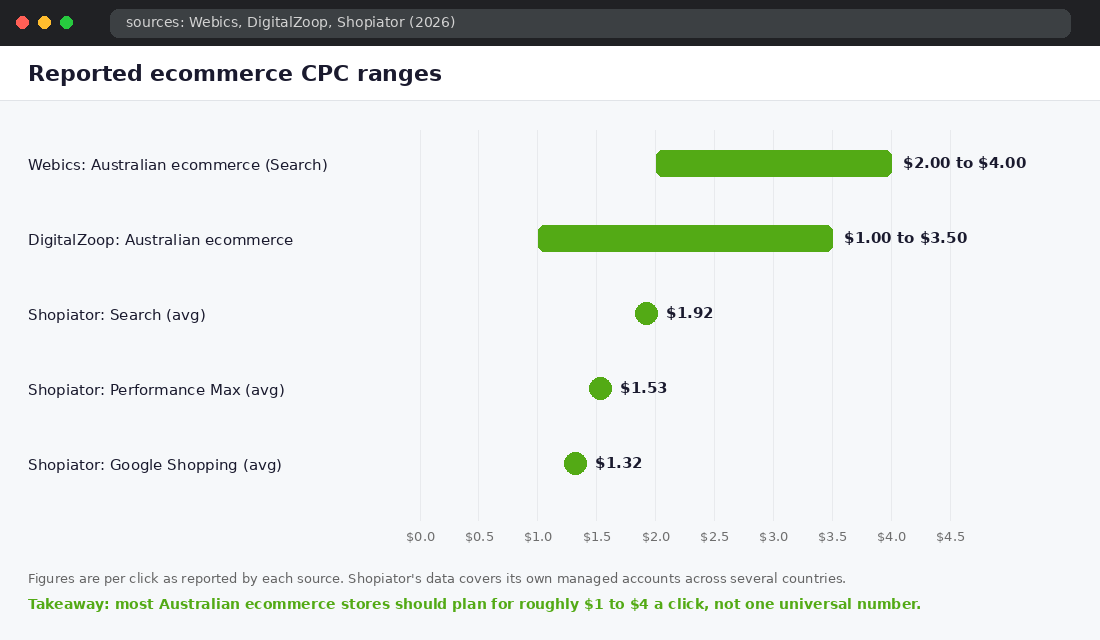
Read those together and a practical planning band appears. For an Australian ecommerce store, plan on $1 to $4 a click, with Shopping and Performance Max usually at the lower end and non-brand Search at the upper end. Brand search (people typing your store name) sits far below that, often under $0.50, which is why it flatters blended account reports.
Two cautions. First, none of these sources publishes its sampling method, and the Australian pages do not name their data origin. Second, the WordStream trend matters more than the level: click costs are climbing year on year across nearly every industry. A CPC you could hold in 2024 may not hold now. That is why you need a ceiling you calculate yourself, not a benchmark you borrow.
The Number That Matters: Your Maximum CPC
A benchmark tells you what others pay. Your maximum CPC tells you what you can afford. It takes three numbers you already have.
- Average order value (AOV): what a typical order brings in.
- Gross margin: the percentage left after product cost (and ideally shipping you absorb).
- Conversion rate: the percentage of Google clicks that become orders, from GA4 or Shopify for the Google channel only.
The formula runs in two steps:
- Break-even CPA = AOV x gross margin %
- Break-even CPC = break-even CPA x conversion rate
Take a store with a $120 AOV and a 55% gross margin. The break-even CPA is $66. If the store converts 2% of Google clicks, the break-even CPC is $66 x 0.02 = $1.32. Pay $1.32 a click and you break even on the first order. Pay $1.80 and you lose about $0.48 on every click’s worth of traffic, which adds up to $24 lost on every 50 clicks.
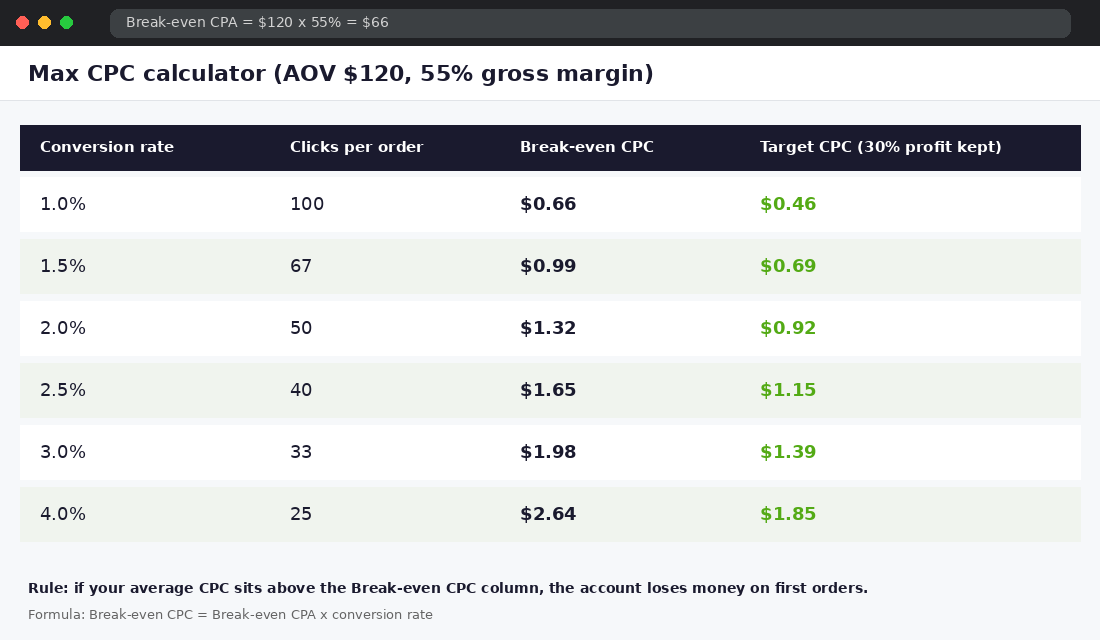
Look at the table. The same store can afford $0.66 a click at 1% conversion or $2.64 a click at 4%. Conversion rate is not a separate project from ad cost. It sets the price you are allowed to pay. This is also why a competitor can outbid you and still be profitable: their site converts better, so their ceiling is higher. Our Shopify CRO audit is the quickest way to lift that ceiling.
Leave room for profit, not just break-even
Break-even is the floor. We ask members to set a target CPC at about 70% of break-even, which leaves roughly 30% of first-order gross profit as cash. Stores with strong repeat purchase can run closer to break-even because the second and third orders pay the bill. If your repeat rate is low, hold the 70% line.
Shopping vs Search vs Performance Max: What Each Costs
Where your ad appears changes the click price, but it changes the conversion rate and ROAS as well, so the cheapest click is rarely the best deal. Shopiator’s 2026 benchmark shows the pattern clearly:
- Google Search: $1.92 CPC, 8.36% conversion rate, 5.96x ROAS, $22.92 CPA. Highest click price, best return, because the shopper typed exactly what they want.
- Performance Max: $1.53 CPC, 3.32% conversion rate, 4.37x ROAS, $46.10 CPA.
- Google Shopping: $1.32 CPC, 2.24% conversion rate, 2.81x ROAS, $59.09 CPA. Cheapest click, lowest return in this dataset.
Be careful with that Search conversion rate. It is Shopiator’s own managed-account sample (23 to 25 accounts per channel), and brand searches inflate it. Do not expect 8% on non-brand terms. The useful lesson is the ordering: the channel with the dearest click often has the lowest cost per order, because intent is higher.
In practice, a healthy Australian Shopify account usually runs a mix. Brand search protects your name for pennies. Shopping or Performance Max (fed by a clean Merchant Center product feed) carries the volume. Non-brand search picks off high-intent terms. Our Google Ads vs Meta Ads comparison explains where to start if you are choosing between platforms, and the negative keywords starter list stops your Search budget leaking onto clicks that never buy.
Five Things That Move Your CPC (And Which You Control)
Google sets your actual CPC in an auction, so you never pick it directly. You influence it through these five levers.
1. Quality: ad relevance and landing page experience
Google scores how closely your ad matches the search and how good your landing page is. Higher quality earns a lower price for the same position. Sending a search for “women’s linen shirt” to your homepage instead of the linen shirt collection is the most common and most expensive mistake we see.
2. Competition for your category
Product categories with many advertisers and high order values cost more. Electronics and fitness equipment attract bigger budgets than low-ticket homewares. You cannot change this, but you can choose narrower, longer search terms where fewer advertisers bid.
3. Match type and search term spread
Broad targeting pulls in cheap but loosely related clicks that rarely convert. A tighter keyword list usually lifts your CPC a little and your conversion rate a lot. Judge by cost per order, not cost per click.
4. Device, location and time
Mobile clicks usually cost less and convert less than desktop for higher-ticket items. Metro postcodes in Sydney and Melbourne tend to be the most contested. Check the device and location reports in Google Ads before you assume a single CPC applies everywhere.
5. Season
Click costs rise in Q4 because every retailer is bidding for the same shoppers. Shopiator’s data shows every channel peaked in Q4 2025, with Search ROAS climbing from 3.91x in Q1 to 8.03x in Q4, so returns can rise alongside costs when demand is real. Plan for a higher ceiling in November, but set it from your promotional margin, not your full-price margin. Our BFCM target maths shows how to work that backwards from a revenue goal, and the Meta CPM guide has the equivalent view for Meta.
Two Stores, Same CPC, Opposite Results
Here is how the ceiling changes the decision. These are illustrative stores, not client data, but the arithmetic is exactly what we run in audits.
Store A sells candles at a $65 AOV with a 62% gross margin. Break-even CPA is $40.30. It converts Google traffic at 3.2%, so its break-even CPC is about $1.29. Its Shopping CPC is $1.10. It has room, so the right move is to scale the best sellers by 20% a week and watch CPA.
Store B sells furniture accessories at a $180 AOV with a 38% margin. Break-even CPA is $68.40. It converts at 0.9%, so its break-even CPC is $0.62. Its Search CPC is $1.75. At that price every click loses money, and no bid adjustment fixes it. The fix is the page: shipping clarity, reviews and a tighter product match. Lift conversion to 2% and the break-even CPC becomes $1.37, which is close to workable.
Same platform, same category of click price, opposite decisions. Store A should spend more. Store B should spend less until the site is fixed. A benchmark alone would have told both stores they were “fine” at around $1.50 a click.
How to Check Your Own CPC Properly
Do not read the blended CPC at the top of your Google Ads account. Brand search drags it down and hides the real cost of finding new customers. Do this instead.
- Open Google Ads, go to Campaigns, set the date range to the last 30 days and add the columns Avg. CPC, Conv. rate and Cost / conv..
- Segment by campaign type so Brand, Non-brand Search, Shopping and Performance Max each show their own row.
- In the Search terms report, filter out your brand name and note the CPC on what is left. That is your true new-customer click price.
- Compare each row to the break-even CPC from the calculator above. Anything over the line needs a fix this week.
For forward-looking research, use the free Keyword Planner inside Google Ads (Tools, then Keyword Planner, then Discover new keywords). Enter your product terms, set the location to Australia and read the “top of page bid (low range)” and “(high range)” columns. Those give you a rough auction price per keyword before you spend anything. You need a Google Ads account to use it, but you do not need an active campaign.
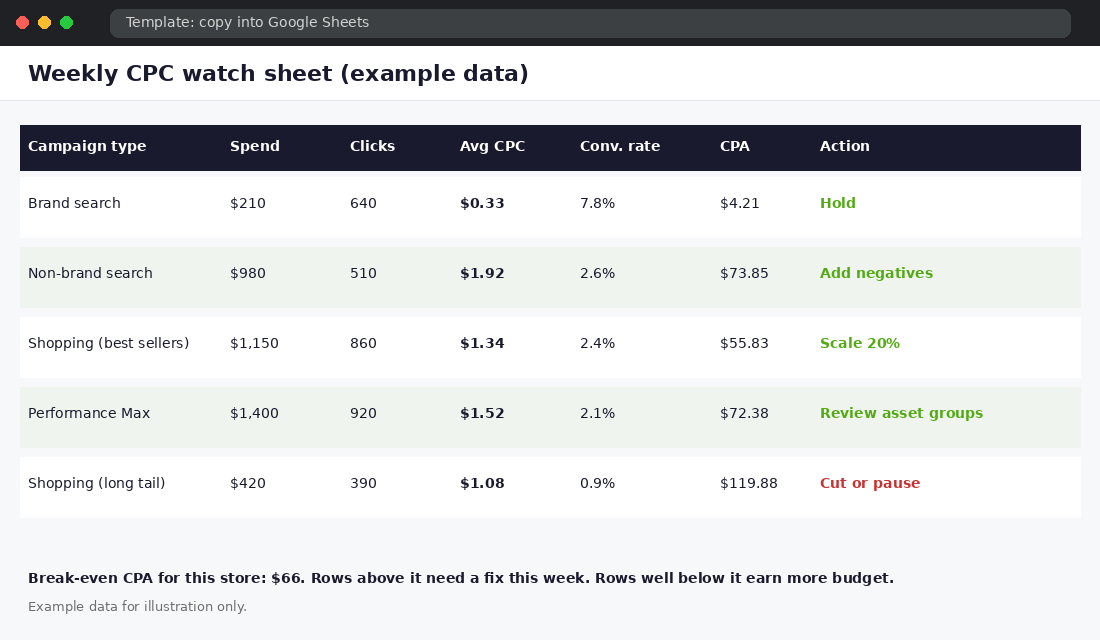
The Weekly CPC Watch Sheet (Template)
Copy this into a Google Sheet. It takes ten minutes on a Monday and tells you which campaigns earn budget and which need a fix.
- Columns: campaign type, spend, clicks, average CPC, conversion rate, CPA, break-even CPA, action.
- Scale (add 20% budget): CPA is at or under 70% of break-even for two weeks running.
- Hold: CPA is between 70% and 100% of break-even.
- Fix: CPA is over break-even. Check search terms, landing page and product feed before touching bids.
- Cut: CPA is over 150% of break-even after at least 30 clicks per product or ad group, and the fix did not work.
Notice the order. Fixing the search terms, landing page and feed comes before touching bids. Raising or lowering bids on a broken page only changes how fast you lose money.
Seven Ways to Lower Your CPC Without Losing Volume
- Add negative keywords weekly. Irrelevant clicks drag conversion rate down and cost per order up.
- Match the landing page to the search. Send product searches to the product or a tight collection, never the homepage.
- Clean your product feed. Titles that include the product type, brand and key attribute earn more relevant Shopping impressions. Fix disapprovals in Merchant Center first.
- Separate best sellers from the long tail. Give proven products their own Shopping campaign so a few hundred poor SKUs do not set the average.
- Use brand search. It is cheap and stops competitors bidding on your name.
- Raise your conversion rate. Reviews, delivery clarity and a faster page lift the ceiling you can afford. Check your conversion benchmarks for where you stand.
- Cut waste before you add budget. Remove the worst 10% of spend (usually irrelevant terms and low-intent placements) and watch what happens to blended CPA.
How It All Compounds
Cost per click is the visible number, but it is the last link in a chain. Better search term hygiene raises relevance. Higher relevance and a better landing page lift quality, which lowers the price you pay. A lower price with a higher conversion rate pushes cost per order under your break-even, which frees budget to scale. More budget at a healthy CPA feeds Google’s bidding with more conversions, and the system gets better at finding buyers.
The reverse is just as real. A weak page raises cost per order, so you cut budget, so Google learns less, so costs rise again. Stores that call Google Ads “too expensive” are usually on the wrong side of that loop. Fix the ceiling first and the click price stops being the problem.
What to Do This Week
- Work out your break-even CPA and break-even CPC with the formula above.
- Pull your non-brand Search and Shopping CPC from the last 30 days.
- Build the watch sheet and mark every row Scale, Hold, Fix or Cut.
- Spend one hour on negative keywords and one on the worst-converting landing page.
Inside eCommerce Circle, paid media cost is one of the core levers we work on with every member, because it only works when profit, product pages and tracking are working too. If you want to see exactly where your store is being capped, take the free More Orders Scorecard. It takes two minutes and shows you which of the 10 P’s to fix first.
Sources: Webics, DigitalZoop, Shopiator, Search Engine Land reporting WordStream/LocaliQ data. Benchmarks vary by source and sample; verify against your own account. Checked 22 Oct 2026.