There is no official Australian ecommerce return rate, but the working benchmark is roughly 30% of orders for fashion and 4% to 12% for jewellery, beauty and health. Australia Post’s 2026 eCommerce Report found that 41% of online shoppers returned at least one item in 2025. That measures shoppers, not orders, so do not mistake it for your return rate.
Most store owners I talk to either have no idea what their return rate is, or they know it and have no idea whether it is good. Both are expensive. A store sitting at 25% returns on a A$120 average order is quietly burning thousands of dollars a month on labels, handling and stock that can never be resold.
This article gives you the benchmarks, the real cost of a return in Australian dollars, a triage method to find which products are causing the damage, and a one-page scorecard to run this week. Where a number is an estimate rather than measured Australian data, I say so.
What is a good ecommerce return rate in Australia?
A good return rate is one that sits at or below the benchmark for your category and leaves your contribution margin intact. The first part is easy to look up. The second part is where most brands get caught out.
Here is the honest state of the data. Australia has no ABS or ACCC figure for the share of online orders that come back. What exists is a mix of retailer disclosures, Australia Post survey data and global benchmarks. The US National Retail Federation put returns at 19.3% of online sales in 2025. UK fashion runs around 35%. Australia sits somewhere in between for apparel, which is why the figures below are labelled as working benchmarks.
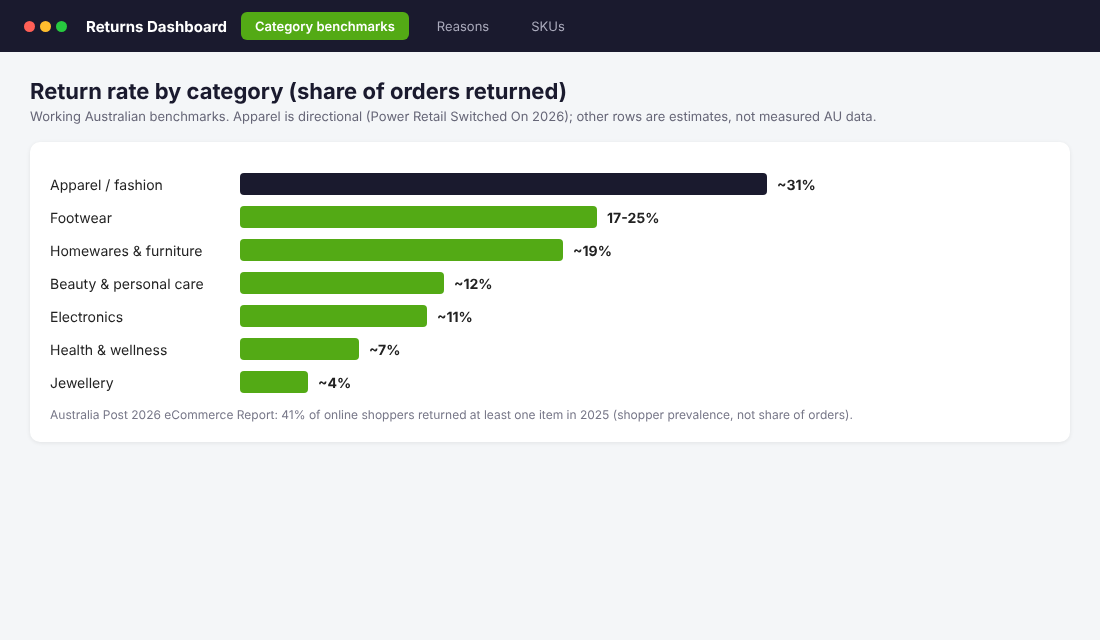
| Category | Working return rate (share of orders) | Data quality |
|---|---|---|
| Apparel and fashion | About 31% | Directional, Power Retail Switched On 2026 |
| Footwear | 17% to 25% | Estimate (Branvas and Richpanel, 2026) |
| Homewares and furniture | About 19% | Estimate |
| Beauty and personal care | About 12% | Estimate |
| Electronics | About 11% | Estimate |
| Health and wellness | About 7% | Estimate |
| Jewellery | About 4% | Estimate |
Treat these as a range, not a target. If you sell dresses and your rate is 24%, you are doing well. If you sell candles and your rate is 24%, something is broken.
A real Australian example: what Birdsnest’s returns data shows
The most useful Australian data I have found comes from Birdsnest, the Australian online fashion retailer. Its founder shared 2024 internal returns data with eCommerceNews Australia in May 2025, and it is worth studying because it shows where returns come from, not just how many there are.
- Dresses and jumpsuits: 31% returned.
- Jeans: 29%. Coats: 24%.
- Swimwear: 27% in the article’s main text, with the founder quoted at 38%. Either way, it is a fit-driven category.
- Underwear: 8%. Jewellery and accessories: 6%.
- Online versus in-store: 23% online, 11% in store, because shoppers try things on before they buy.
- Formal wear: 36% returned, versus 23% casual and 13% essentials.
- Sale items: 26% returned, versus 19% full-price.
- Totals: 85,510 returns worth about A$8.28 million, equal to 23.7% of items sold.
Three lessons sit inside that data. First, returns are concentrated. A few product types drive most of the volume. Second, the higher the stakes of the purchase (a formal dress for an event), the more people order two sizes and send one back. Third, discounted stock comes back more often, so a heavy sale calendar pushes your blended return rate up even if nothing else changes.
That third point matters for the next few weeks. If you are about to run Black Friday, read our guide to Black Friday Australia statistics and budget for a return spike in January.
What a return actually costs you (with the maths)
Most owners count the refund and stop. The real cost of a returned order has three parts: the return label if you pay for it, the labour to inspect and restock, and the stock you cannot resell.
Published Australian figures put return shipping at roughly A$10 to A$25 per parcel and processing at A$3 to A$7 per item. Intersport’s head of marketing has quoted A$7 to A$11 per order for its own returns. Australia Post’s 2025 eCommerce report found return shipping charges rose 30% on the previous year, so assume your carrier costs are going up, not down.
Now apply that to an example store. These are illustrative numbers, so swap in your own.
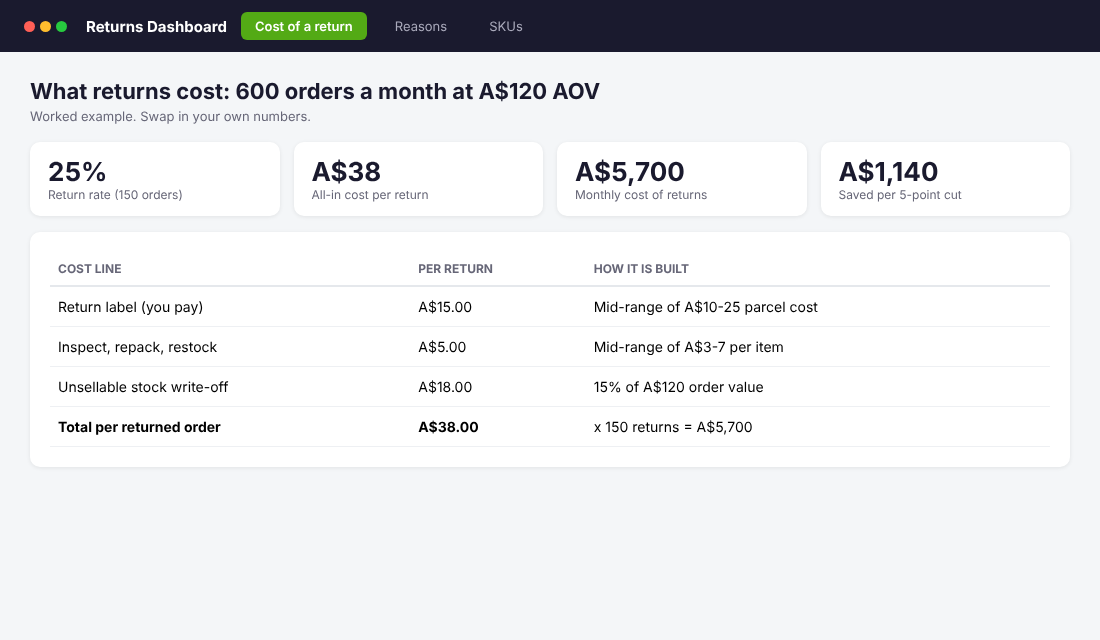
- 600 orders a month at an A$120 average order value.
- 25% return rate means 150 returned orders.
- Return label: A$15. Inspect and restock: A$5. Unsellable stock write-off: 15% of A$120, or A$18.
- All-in cost per return: A$38. Multiply by 150 and returns cost you A$5,700 a month, before the lost sale itself.
- Cut the rate from 25% to 20% and you save 30 returns, or A$1,140 a month.
That A$1,140 is pure margin. To earn the same from new customers at a 25% contribution margin you would need roughly A$4,560 in extra revenue. Reducing returns is one of the cheapest profit levers in the business, and it feeds straight into your break even ROAS, because every returned order makes your real ROAS lower than the number in Ads Manager.
Why people return things (and which reasons you can fix)
Not every return is a failure. Split reasons into three buckets before you touch anything.
Bucket 1: Preventable with better information
Wrong size, colour not as shown, material not as expected, bigger or smaller than imagined. This is the largest bucket for most stores and the one you can attack directly with size guides, model measurements, fit notes and better photography. Our size and fit playbook goes deep on this.
Bucket 2: Preventable with better operations
Damaged in transit, wrong item sent, arrived late. These are your fault, and they are also the returns that trigger the strongest consumer rights. Fix packing, picking accuracy and carrier choice.
Bucket 3: Acceptable cost of doing business
Genuine change of mind, gifts that were not wanted, bracketing (ordering two sizes). You will never get these to zero. Your job is to make them cheap by routing them to exchanges and store credit instead of refunds. See our returns reduction playbook for the exchange-first flow.
One more data point worth knowing. Birdsnest found items with lower star ratings were returned more often: products rated 2 and 3 stars came back around 30%, compared with about 22% to 23% for 4 and 5 stars. Your reviews are an early warning system for your return rate.
Your legal position under Australian Consumer Law
Returns policy design is not just a margin question in Australia. It is a legal one. According to the ACCC, the consumer guarantees do not require you to offer refunds for change of mind. But if you do have a change of mind policy, you must follow it.
What you cannot do is override rights on faulty goods. The ACCC states that businesses cannot take away a consumer’s right to a refund or replacement for faulty products, and that relying on terms like “no refunds” or “no refunds or exchanges on sale items” is illegal. For a major problem, the customer can choose a refund or replacement. For a minor one, you must at least repair it for free.
That is general information, not legal advice. Our Shopify returns policy template for Australia covers the wording, and our return abuse defence guide covers what to do about serial returners without breaching the law.
The free returns trend: what Australian retailers are doing
Free returns are disappearing. Shippit data cited by ChannelNews shows only 14% of about 1,617 Australian and 266 New Zealand retailers now offer free returns, down from 49% in 2018. ASOS ended free returns in Australia in June 2023. Australia Post’s report found 30% of businesses offer paid returns, 15% offer no returns and 34% offer free returns.
But customers still want them. Australia Post found 65% of shoppers value friction-free returns, rising to 72% among Gen Z and Millennials. The Iconic, David Jones and Myer all still offer free returns, and Afends offers free returns when the customer takes store credit instead of a refund.
The Afends model is the smartest one for a small brand. You give the customer what they want (no cost to return) in exchange for what you want (the money stays in your business). Store credit also lifts your repeat purchase rate, because the customer has a reason to come back.
There is a cost to this too. Good360 reported that about 30% of clothing bought online and returned in 2024 went to landfill instead of being resold. Customers care about that more than you might think, so a returns flow that fixes stock and relists it quickly is both a margin win and a brand story.
The Return Triage Method: find the products causing 80% of the damage
Do not try to fix your whole catalogue. Rank by cost, fix the top five, then repeat. Here is the exact process.
- Export 90 days of orders and returns from Shopify (Orders, then Export). Include SKU, order value and return reason.
- Calculate return rate per product (units returned divided by units sold). Ignore anything with fewer than 20 sales.
- Multiply by your all-in cost per return (use A$38 as a starting point or your own number from the calculator above).
- Sort descending by total cost. The top five products usually account for most of it.
- Tag each one with its reason bucket (information, operations or acceptable) and assign one fix.
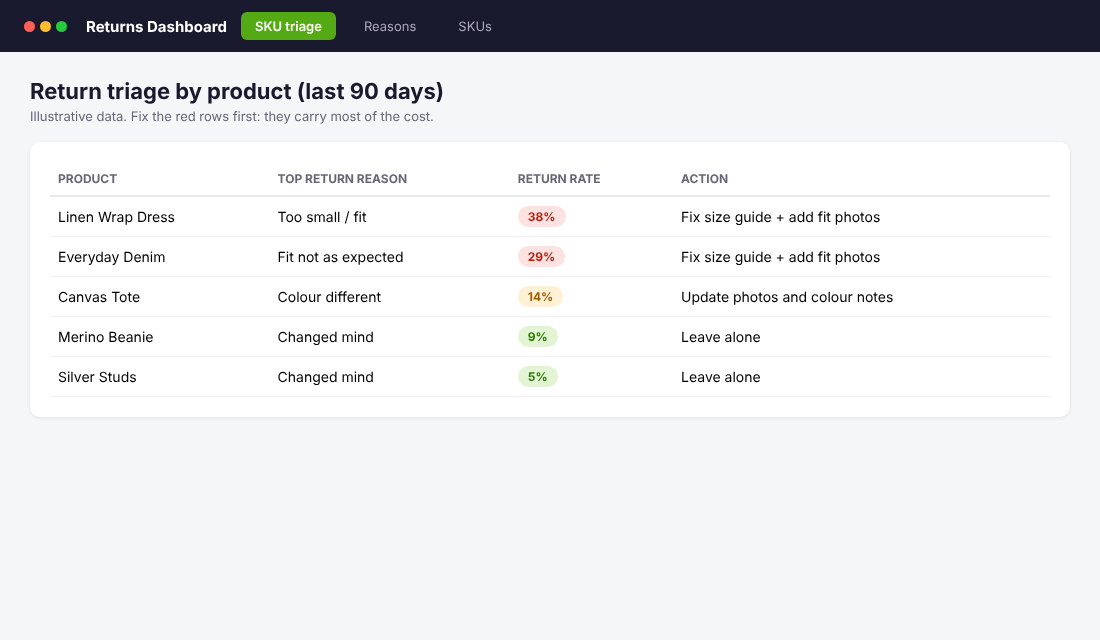
Use Shopify’s built-in return management (the Return option on each order in your admin) so every return gets a reason code. If you are processing more than a few dozen returns a month, a dedicated returns app such as Loop Returns or AfterShip Returns can add self-serve return portals and exchange-first flows. Check current pricing on each app’s listing before you commit, as plans change.
Setup steps for tracking return reasons
- In Shopify admin, open an order and use Return items so each return is logged against the order.
- Add a short reason list: too small, too large, colour different, quality, damaged, wrong item, changed mind.
- Tag orders with the reason (or use your returns app’s reason codes) so you can filter later.
- Every month, export the data and rerun the triage. Pin the top five products on a whiteboard.
If you already run a Monday numbers meeting, add return rate to it. Our weekly scorecard is a good place to slot it in.
Six fixes that actually move the number
- Show the fit, not just a size chart. Add model height and the size worn, plus a ‘runs small’ or ‘true to size’ label based on actual return data.
- Photograph in real light and show the colour honestly. Colour mismatch is a cheap return to prevent.
- Offer exchanges first. Put ‘Exchange for a different size’ above ‘Refund’ in your returns portal. Many customers take it.
- Set a return window that fits the product. A shorter window for sale items cuts bracketing without breaking consumer law, as long as you do not deny faulty-goods rights.
- Fix the pack. Review the damaged and wrong-item returns separately, because they are 100% on you.
- Watch your sale calendar. Sale items return more (26% versus 19% at Birdsnest). Price test before you discount the whole range.
How to read your rate if you do not sell fashion
If you sell beauty, health or homewares, your rate will look low next to the fashion headlines, and that can lull you into ignoring it. Don’t. A 9% return rate in health and wellness sounds fine against a benchmark of about 7%, but those returns are often consumables that cannot be resold at all. The write-off share of your cost per return could be close to 100% instead of the 15% in the example above.
Flip the maths for your category. Use the actual resale rate on returned stock, then multiply. A store selling A$60 skincare with a 12% return rate and zero resale loses A$60 plus handling on every return. That is a far bigger hit than a dress store that relists most of what comes back.
Also check bracketing. If customers regularly buy two or three variants and return the extras, your rate looks bad but your net sales are fine. Look at net revenue per customer, not only return rate, before you tighten policy and risk losing the sale in the first place.
The compound effect: returns touch every P
A return is not only a Protection issue. It is a Product issue (is the page accurate?), a Profit issue (A$38 gone per return), a Patrons issue (does the exchange keep the customer?), and a Practice issue (do you review the data every month?). Fix one product page and you lift conversion, lower returns and improve your reviews in the same move.
That is why I treat return rate as a leading indicator. When it creeps up, something upstream has changed: a new supplier, a worse size chart, an over-promising ad. Catch it in the data and you fix a small problem instead of a margin crisis.
Your one-page Return Rate Scorecard (copy this)
Run this every month. It takes 30 minutes once the export is set up.
| Metric | Your number | Target | Action if off |
|---|---|---|---|
| Overall return rate (units returned / units sold) | ___% | At or below your category benchmark | Run the triage method |
| All-in cost per return | A$___ | Known and tracked | Rebuild in the calculator |
| Monthly cost of returns | A$___ | Under 5% of revenue | Cut top 5 SKUs first |
| Share of returns that are information-driven | ___% | Falling month on month | Fix size guides and photos |
| Share of returns taken as exchange or credit | ___% | Rising month on month | Move exchange above refund |
| Return rate on sale items vs full price | ___% vs ___% | Gap under 7 points | Test discount depth |
| Damaged or wrong-item returns | ___% | Under 2% of orders | Audit packing and carrier |
The 5% of revenue target is my own rule of thumb for a healthy store, not an industry standard. Adjust it for your margin structure.
What to do this week
- Export your last 90 days of orders and returns and calculate your overall rate.
- Compare it with the category benchmark in the table above.
- Work out your all-in cost per return using the calculator example.
- Run the triage method and pick your top five products.
- Fix one thing on each: size guide, photos, packing or exchange flow.
Returns are not glamorous, but they are one of the few places where an afternoon of work gives you a permanent margin gain. If you are about to run a big sale, do it before the volume arrives.
Inside eCommerce Circle, returns and margin protection are core pillars we work on with every member. If you want to see exactly where your store is being capped, take the free More Orders Scorecard. It takes two minutes and shows you which of the 10 P’s to fix first.
Sources
- Australia Post, 2026 eCommerce Report (41% of online shoppers returned at least one item in 2025), as cited by Eightx.
- eCommerceNews Australia, 16 May 2025: Birdsnest 2024 returns data.
- ChannelNews, Australian retailers slash free returns (Shippit data, Australia Post 2025 report, Good360).
- ACCC, Repair, replace, refund (consumer guarantees).
- NRF 2025 Retail Returns Landscape (US 19.3% of online sales), as cited by Eightx.
- Category estimates: Branvas and Richpanel (2026), Power Retail Switched On 2026, as cited by Eightx.