Open four tabs right now. Shopify Admin, GA4, Meta Ads Manager, Klaviyo. Pull last month’s revenue from each one. You will get four different numbers, and the spread between the highest and the lowest will probably be wider than your entire net profit for the month.
What’s in This Article
Most Aussie founders respond to this in one of two ways. Either they pick whichever number looks best and quote it in the team meeting, or they decide all analytics is broken and go back to eyeballing the Shopify dashboard once a day. Both responses cost you money, because the decisions you make next depend entirely on which number you believed.
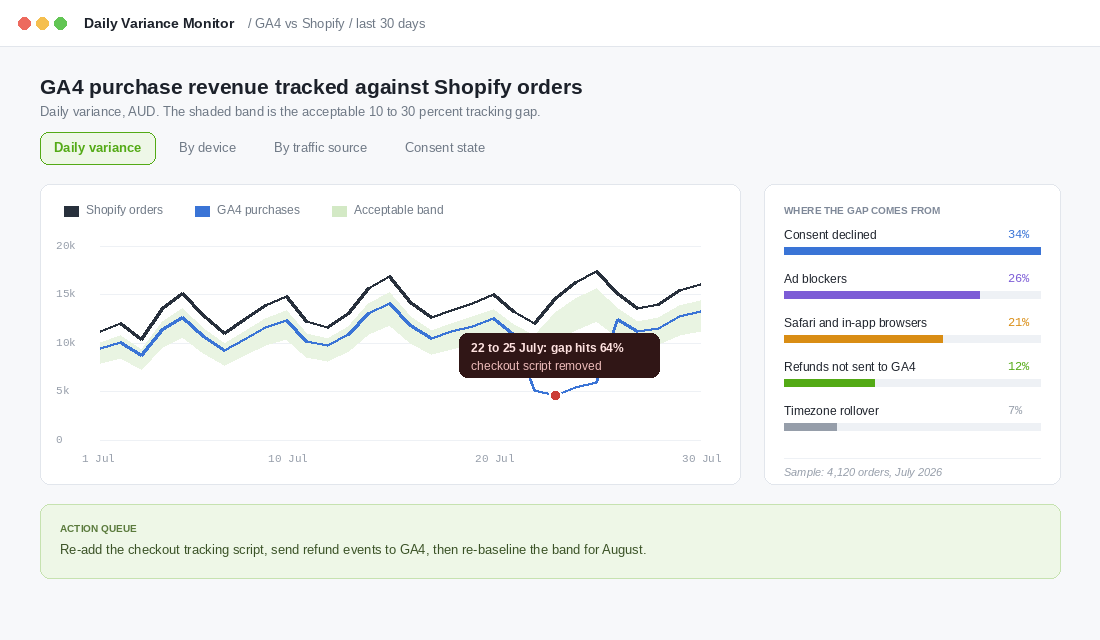
The brands that scale past 500k a month do something different. They stop trying to make the numbers agree and instead build a reconciliation habit: one ledger, an expected variance band for every other source, and a written explanation any time a source drifts outside its band. A GA4 figure sitting 10 to 30 percent under Shopify is completely normal and needs no action. That same gap jumping to 64 percent overnight means a tracking script broke on your checkout, and every hour you spend not noticing is an hour of blind ad spend.
Four Platforms, Four Counting Rules, One Bank Account
Your platforms are not lying to you. They are answering four completely different questions, and nobody told you the questions were different.
Shopify answers “what did we sell?” It records revenue from completed orders inside your store, on the order date, in your store currency. Gross sales excludes GST. Net sales takes gross and subtracts discounts and returns. That is a ledger built on transactions, not on tracking.
GA4 answers “what did the browser tell us?” It counts purchase events fired by a tag in the customer’s browser. If the tag does not fire, the revenue does not exist. Sessions end after 30 minutes of inactivity, and Shopify’s own session counting rolls over at midnight UTC while your reports display in your store timezone. That single detail shifts revenue between days for every Australian store on the planet.
Meta answers “who did we influence?” On its default window of 7 day click plus 1 day view, Meta claims a purchase made within a day of someone merely seeing your ad. Never clicking. Just seeing it. Those buyers are real customers, but they will never appear inside Shopify as a Meta order.
Klaviyo answers “who did we last touch?” By default it assigns the full value of an order to the last message a customer clicked or opened within roughly a 5 day window, and a 1 day window for SMS clicks. Open-based attribution in a world of Apple Mail privacy protection means machines are triggering some of those opens, not people.
Four honest answers to four different questions. The mistake is treating them as four attempts at the same answer.
Step 1: Name Your Ledger Before You Compare Anything
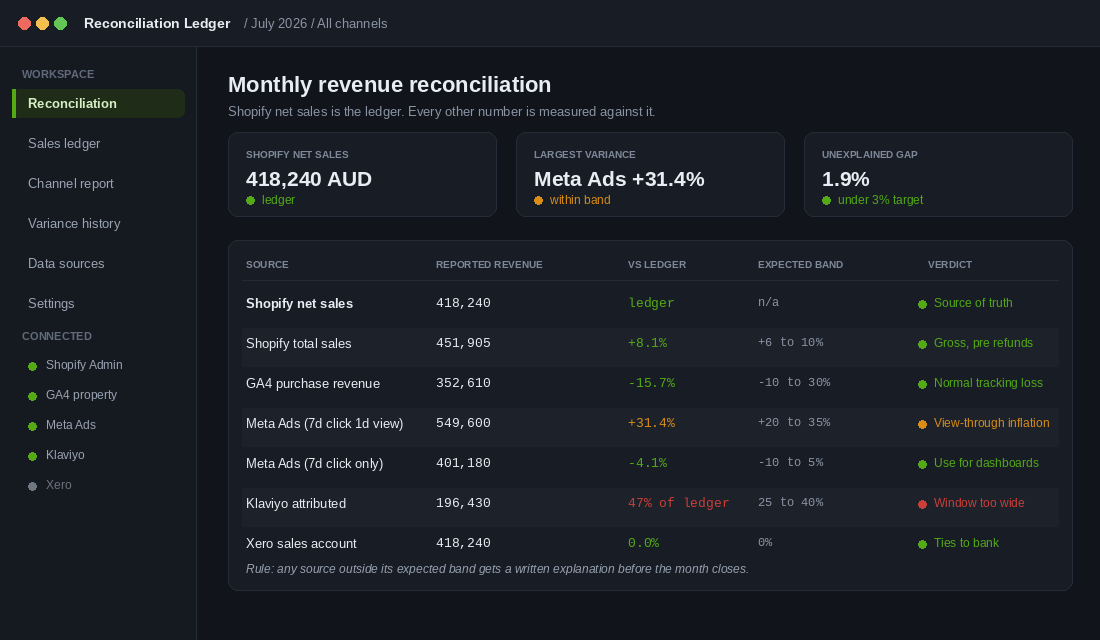
You cannot reconcile without a ledger, and the ledger is not up for debate. It is Shopify net sales. Not total sales, not GA4, not the blended figure your dashboard app invented.
Net sales is the right choice because it is the only number that behaves like money. It nets off discounts and refunds, it excludes GST so you are not counting the tax office’s revenue as your own, and it ties directly to what lands in your account once fees are settled. Every other figure in your business gets measured against it.
Write this down somewhere the whole team can see it, because the arguments you avoid are worth more than the arguments you win:
- Ledger revenue. Shopify net sales, store timezone, GST excluded. This is the number that goes in the board pack and the bank reconciliation.
- Channel revenue. Whatever your chosen attribution source says a channel produced. Useful for deciding where the next dollar goes. Never used as a total.
- Platform-reported revenue. What Meta, Google or Klaviyo claim. Directional only. Never summed across platforms, because they all count the same order.
The moment somebody adds Meta revenue to Klaviyo revenue to Google revenue, you have a number larger than your actual sales and a marketing plan built on fiction. I have sat in front of Aussie brands whose “channel totals” added up to 140 percent of their real revenue, and every budget decision for the quarter had been made off that spreadsheet.
Step 2: Give Every Source an Expected Variance Band
Here is the shift that changes everything. Stop asking “why do these not match?” and start asking “is this gap the size I expect?” A gap you predicted is information. A gap you did not predict is a fault.
These are the bands to start with. Baseline them against your own store over three clean months, then treat them as tripwires:
- Shopify total sales vs net sales: plus 6 to 10 percent. Total sales is gross, before refunds and discounts land. If the gap is widening month on month, your returns rate is climbing, not your revenue.
- GA4 purchase revenue vs ledger: minus 10 to 30 percent is the widely accepted normal range for ecommerce, and a tight, well-configured build with server-side tracking can hold minus 5 to 10 percent. Anything past 30 percent needs investigation.
- Meta on default window vs ledger: plus 20 to 35 percent. That excess is view-through and modelled conversions doing exactly what they were designed to do.
- Meta on 7 day click only vs ledger: roughly minus 10 to plus 5 percent. This is the version you put in dashboards.
- Klaviyo attributed revenue as a share of ledger: 25 to 40 percent for a mature email and SMS program on honest settings. If you are seeing 45 percent or more, your windows are too wide, not your emails too good.
- Accounting revenue vs ledger: zero. If your Xero sales account does not tie to Shopify net sales, you have a bookkeeping problem, not an analytics one.
Two rules make the bands useful. First, a source that stays inside its band gets no attention, no matter how ugly the gap looks. Second, a source that breaks its band gets a one-line written cause before the month closes. Not a theory. A cause.
Step 3: Diagnose the GA4 Gap in Five Buckets
GA4 will always sit under Shopify, and the reasons sort neatly into five buckets. Work them in this order, because the fix effort climbs as you go down the list.
- Consent declines. Customers who reject tracking do not fire a purchase event. Google’s consent mode modelling claims to recover more than 70 percent of ad-click-to-conversion journeys lost to declines, but recovery is modelled, not measured, so it will never rebuild the full picture.
- Ad blockers and privacy browsers. IAB Australia research from April 2026 puts ad blocker use among online Australians at around 25 percent, roughly one in four, and stabilising. Every blocked pixel is a silent invisible order.
- Safari and in-app browsers. Customers arriving through Instagram or TikTok in-app browsers behave differently and drop identifiers faster. If your traffic skews social, expect a wider gap than a brand living on Google.
- Refunds never sent to GA4. Shopify nets refunds off automatically. GA4 only knows about a refund if you explicitly send a refund event. Skip that and you are comparing a gross number to a net one and calling it a discrepancy.
- Timezone rollover. Shopify’s analytics layer rolls the day at midnight UTC in places while displaying in your store timezone. For an AEST store that shifts a chunk of every day’s orders. It washes out over a month and wrecks any single-day comparison.
Once you have named your buckets, the biggest win available is moving your tracking off the browser where you can. Server-side tracking will not close the gap completely, but it reliably narrows it, and it survives ad blockers. If you have not set that up yet, work through the Shopify server-side tracking playbook before you touch anything else in this list.
Step 4: Lock One Meta Attribution Window and Leave It Alone
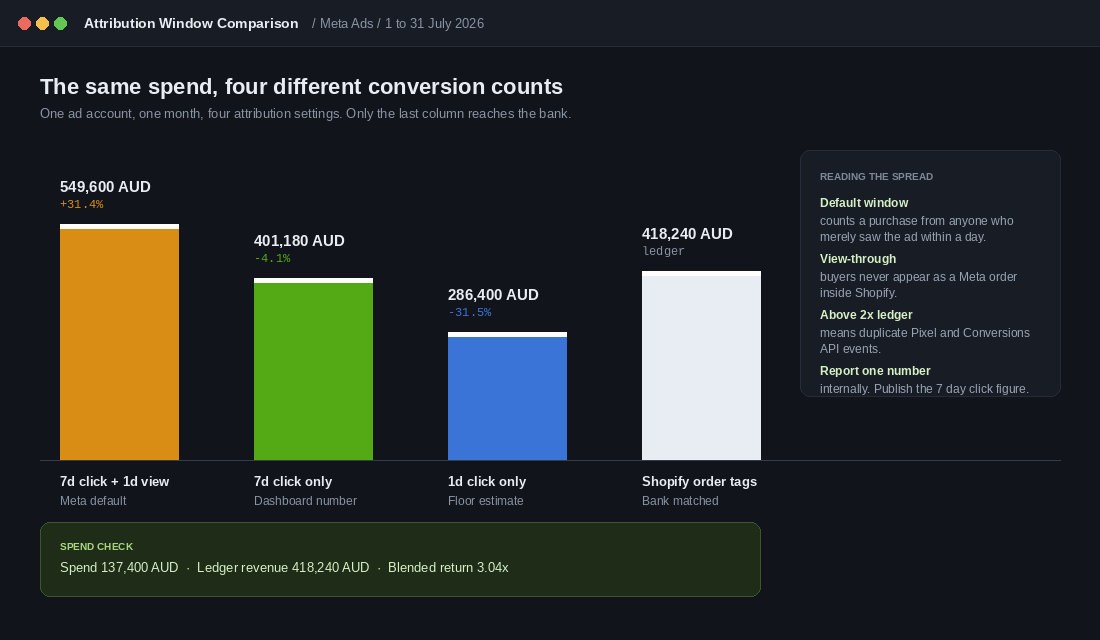
Meta gives you a dial that changes your reported revenue by more than 90 percent without changing a single thing about your business. Same spend, same month, same customers, four different answers depending on where you leave the dial.
The default 7 day click plus 1 day view is the most generous setting. It runs 20 to 35 percent above what Shopify will confirm, and the excess is almost entirely view-through and modelled conversions. That is not fraud and it is not useless. View-through influence is real. It is just not bankable.
Here is the operating decision. Pick 7 day click only as your internal reporting standard and never change it again. It lands within a few percent of what you can reconcile against the ledger, which means your media buyer and your bookkeeper are finally arguing about the same number.
Then watch for the one signal that means something is genuinely broken: if Meta reports more than double your ledger revenue, you have duplicate events. That is the Pixel and the Conversions API both firing the same purchase without deduplication, and it is one of the most common misconfigurations on Australian Shopify stores. Check your event IDs before you touch a single campaign.
The complementary move is tagging your own traffic properly so Shopify can tell you what it sees, independent of Meta. Clean, consistent UTMs give you a second opinion that costs nothing. The UTM tracking playbook covers the naming convention worth locking in before your next campaign goes live.
Step 5: Tighten Klaviyo Before You Quote a Revenue Share
Every founder wants to say email drives 40 percent of revenue. On Klaviyo’s default settings, plenty of stores can say it without any of it being true.
The defaults assign a full order value to the last message a customer clicked or opened inside a 5 day window. Three problems stack up. Apple Mail privacy protection triggers automated opens that no human performed. Bot clicks from security scanners look identical to real clicks. And on a subscription store, a scheduled renewal that was always going to happen gets credited to whatever newsletter happened to land that week.
Melbourne’s Who Gives A Crap runs a large recurring subscription base alongside its one-off range. On default settings, a business shaped like that will hand a meaningful slice of predictable renewal revenue to the email program, and the reported revenue share climbs while nothing about the actual marketing improved. That is not a Klaviyo flaw. It is a settings choice nobody revisited.
Tighten it in four moves inside Klaviyo’s attribution settings:
- Exclude automated opens so Apple’s machine opens stop counting as engagement.
- Shorten the open window from 5 days to 1 to 3 days, or move to clicks-only attribution if you want the strictest read.
- Segment out subscription renewals and report them as recurring revenue, separately from campaign-driven revenue.
- Re-baseline your reported share after the change and tell the team the drop is a measurement change, not a performance drop.
Expect your email revenue share to fall by a third when you do this honestly. That is the point. A 26 percent number you trust is worth more than a 44 percent number you have to caveat every time you say it out loud.
Step 6: Walk the Ledger All the Way to the Bank
This is the step almost everybody skips, and it is the one that catches actual missing money rather than measurement noise.
Shopify net sales should tie to your accounting revenue exactly. Not approximately. Where it fails, the cause is nearly always one of a short list: payouts landing in the following period, gateway fees netted before deposit, gift card redemptions booked as revenue twice, marketplace and wholesale orders living outside Shopify, or physical retail orders arriving through Shopify POS.
That last one matters more than people expect. Bared Footwear runs physical stores across several Australian cities alongside its online store. Those in-store orders flow into Shopify total sales but never touch GA4, because nobody browsed a website. A brand with that shape will show a permanently wider GA4 gap than a pure online player, and it is a channel mix fact, not a tracking failure. If you do not split your ledger by sales channel before you compare, you will chase a bug that was never there.
Multi-currency does the same thing in reverse. Australian luggage brand July sells into multiple markets, which means presentment currency and store currency diverge on the same order. Compare a converted figure to an unconverted one and you invent a variance out of thin air. Pick store currency for every reconciliation and stay there. The mechanics of tying the ledger to your books are covered in the Shopify and Xero reconciliation walkthrough.
The Tool Setup: A Reconciliation Layer in 40 Minutes
You can run this whole audit in a spreadsheet, and for stores under about 100k a month you probably should. Six rows, six bands, updated monthly. Do not buy software to solve a discipline problem.
Above that, a first-party attribution layer earns its keep because it gives you a fifth opinion that is not dependent on any ad platform’s self-reporting. Triple Whale is the most common choice on Australian Shopify stores. Here is the setup that actually produces a reconcilable number:
- Install the Triple Pixel. One-click install on a standard Shopify theme. Headless builds need a script added manually. Give it 7 to 14 days to build identity data before you trust anything it says.
- Connect Shopify first, ad platforms second. Shopify becomes the order source. If you connect Meta first, you anchor on the inflated number.
- Turn on the post-purchase survey. It is free, it installs in one click, and a simple “how did you hear about us?” on the thank you page gives you a self-reported channel read that no pixel can produce.
- Set your comparison view to Shopify orders, not pixel orders. This is the setting most people miss, and it is the difference between a tool that reconciles and a tool that becomes a fourth number to argue about.
- Exclude off-Shopify revenue. If a real share of your sales comes from Amazon, eBay, wholesale or retail, a Shopify-based tool cannot be your single source of truth. Keep those in the spreadsheet.
One warning worth saying plainly. A first-party pixel is another measurement system with its own assumptions, not an oracle. It belongs in your reconciliation table as another row with its own expected band, not above the table as the final word.
The 30-Minute Monthly Reconciliation Ritual
Here is the whole thing as a checklist. Run it on the third business day of every month, before you make a single budget decision. Half an hour, same order, every time.
- Minutes 1 to 5. Pull Shopify net sales for the closed month, store timezone, GST excluded, split by sales channel. Write it at the top of the sheet. This is the ledger.
- Minutes 6 to 10. Pull Shopify total sales, GA4 purchase revenue, Meta on both windows, Klaviyo attributed, and your accounting revenue. Six numbers, one column.
- Minutes 11 to 15. Calculate each variance against the ledger as a percentage. Colour each one green inside its band, amber within 5 points of breaching, red outside.
- Minutes 16 to 25. For every amber and red, write one sentence naming the cause. “Checkout script removed on 22 July.” “New retail store opened, POS share up.” Vague causes like “tracking issues” are not accepted.
- Minutes 26 to 30. Turn every red into a single owned task with a name and a date. Then update the band if the cause is structural and permanent rather than a fault.
Two disciplines make it stick. Keep the sheet as a running history so you can see bands drifting over quarters, and never change a band in the same session where you discovered a breach. Fix first, re-baseline next month.
This slots directly underneath whatever weekly rhythm you already run. If you do not have one yet, the weekly scorecard playbook is the frame this reconciliation feeds.
Why Reconciliation Compounds Faster Than Any Test You Run
Look at what these six steps do together, because the compounding is not obvious until you see it as a system.
Naming the ledger ends the debate about whose number is right, which means meetings get shorter and decisions get faster. Setting bands converts noise into signal, so a broken checkout script surfaces in four days instead of at the end of the quarter. Locking one Meta window means your scaling decisions are made on a figure that survives contact with the bank statement. Tightening Klaviyo means you stop over-investing in a channel that was quietly claiming credit for revenue it did not create. Tying the ledger to your accounts means the money you think you made is the money you actually have.
None of it is glamorous. There is no dopamine hit in a spreadsheet full of green cells. But consider the arithmetic. A store spending 130k a month on media that is over-reading Meta by 30 percent will keep pushing budget into campaigns delivering roughly a third less than the dashboard claims. Nothing about creative, offer or landing page fixes that, because the input to every decision is wrong.
Reconciliation is the cheapest performance work available to you. You are not buying more traffic or building a new funnel. You are making sure the instruments in front of you are calibrated, which raises the quality of every single decision you make afterwards. That is what compounds.
Start this week with one thing. Open your last three closed months, calculate the GA4 gap for each, and see whether it is stable. If it is, your instruments are fine and you can trust your dashboard. If it moved by more than 10 points between any two months, something broke and nobody noticed, and finding it will be the highest-return hour you spend this month.
Inside eCommerce Circle, getting the measurement layer honest is one of the first things we work on with every member, because everything else we build sits on top of it. If you want a second opinion on yours, let’s talk.