Most Shopify stores set their Google Ads budget the same way they pick a restaurant: they look at what feels affordable, pick a round number like $50 a day, and hope for the best. Then three weeks later they see a thin return, decide Google “doesn’t work for us”, and switch it off.
What’s in This Article
The budget was never the problem. The method was. A Google Ads budget isn’t a number you guess. It’s the output of three numbers you already own: your margin, your average order value, and the number of orders you want. Get those right and the budget falls out of simple maths. Get them wrong and no amount of campaign tuning will save you.
This guide gives you the exact formula we use with Australian Shopify brands, the minimum spend that gives Google’s bidding enough data to work, and a split across Shopping, brand search and Performance Max. You’ll also get a one-page budget template you can fill in tonight.
Why Google Ads Is Worth Budgeting For in Australia
Australians are buying online at record levels. According to the Australia Post 2026 eCommerce Report, online spend hit A$82.6 billion in 2025, up 14% on the year before, and now makes up about 24% of all retail spending. Around 9.8 million households, roughly 82% of the country, shopped online.
That’s a lot of people typing a product name into Google before they buy. Unlike Meta, where you interrupt someone scrolling, Google puts your product in front of a person who is already looking. It’s the closest thing paid media has to a warm lead.
The catch is that Google rewards the stores that feed it data and punishes the ones that starve it. A budget that’s too small doesn’t just limit your sales. It stops the bidding system from learning, so your cost per order stays high and the whole channel looks broken. If you’re also running Meta, read our companion guide on the Meta Ads budget for Shopify stores so you can split spend sensibly across both.
The Wrong Way: Budgeting by Feel
Here are the three most common budget mistakes we see when we audit accounts.
- The round number. “$30 a day sounds fine.” It might be. It might also be a third of what you need to reach 30 conversions a month. You have no way to tell without the maths.
- The percentage of revenue shortcut used too early. A rule like “spend 10% of revenue on ads” is a decent sanity check for a mature store. For a store doing A$15,000 a month, it gives you A$1,500, which may or may not be enough to feed the algorithm in your category.
- Copying a competitor. You can’t see their margin, their repeat rate or their returns. Matching their spend tells you nothing.
The fix is to start from profit and work backwards.
Step 1: Work Out Your Break-Even CPA (The Number Everything Hangs On)
Your cost per acquisition, or CPA, is how much you pay Google to get one order. Your break-even CPA is the most you can pay before that order loses you money.
Use gross profit per order, not revenue. Here’s the formula:
Break-even CPA = Average order value x Gross margin %
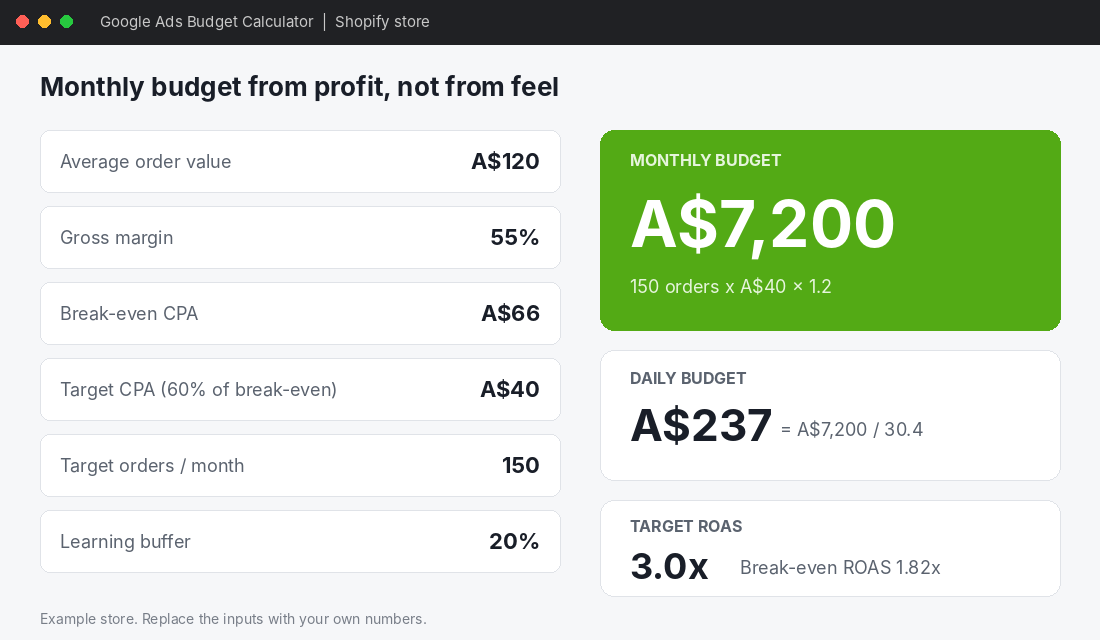
Say your average order value is A$120 and your gross margin is 55% after product cost. Your gross profit on a first order is A$66. Pay more than A$66 to acquire that customer and you lose money on the first sale.
That’s your ceiling. You don’t want to run at the ceiling, because you still have to pay for shipping, payment fees, staff and rent. So set a target CPA at roughly 60% of break-even. In this example that’s about A$40.
Two more numbers to keep in view:
- Break-even ROAS is 1 divided by your gross margin. At 55%, it’s 1.82x. Every A$1 of ad spend must return at least A$1.82 in revenue just to cover product cost.
- Target ROAS is your AOV divided by your target CPA. Here that’s A$120 divided by A$40, which is 3.0x.
If you want a deeper look at why average ROAS can hide losing campaigns, our marginal ROAS guide walks through the next step up from this.
A note on repeat customers: if a customer buys two or three times a year, you can justify a higher first-order CPA. But only count repeat revenue you can prove in your own data. Don’t count a lifetime value you’re hoping for.
Step 2: Turn Your Target Orders Into a Monthly Budget
Now the budget itself. Here’s the formula:
Monthly budget = Target orders per month x Target CPA x 1.2
The 1.2 is a 20% buffer for the learning period, when Google is still working out who converts. Agencies commonly quote a 15% to 20% buffer, and we’d rather you over-budget the first month than starve the account.
Using our example store:
- Target orders from Google: 150 per month
- Target CPA: A$40
- Core spend: 150 x A$40 = A$6,000
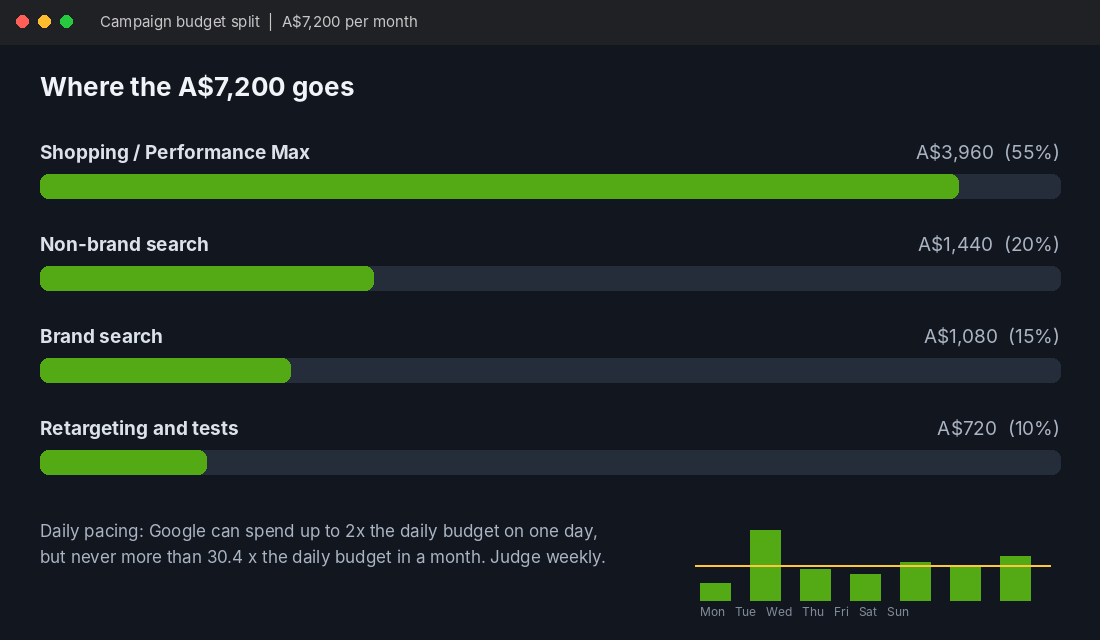
- With the 20% buffer: A$7,200 per month
Google calculates your monthly cap as your average daily budget multiplied by 30.4. So divide A$7,200 by 30.4 and you get a daily budget of about A$237.
One thing catches people out. Google’s own help documentation says your spend can reach up to two times your daily budget on any single day, while the monthly total never exceeds daily budget x 30.4. So a A$237 daily budget might show A$120 on one day and A$470 on another. That’s normal. Judge pacing weekly, not daily.
The “I Don’t Have A$7,200” Version
Most stores don’t. Fair enough. Run the formula backwards from the cash you actually have.
Start with the minimum number of conversions Google needs. Google’s own guidance recommends judging performance over periods with at least 30 conversions, and 50 conversions when you’re using Target ROAS bidding. So take 30 as your absolute floor per campaign.
At a A$40 target CPA, 30 conversions costs A$1,200 a month. At 50 conversions it’s A$2,000. If your total budget can’t cover that for one campaign, you’re not ready to split across several. Run a single Shopping or Performance Max campaign and don’t dilute it.
For context, a Digital8 review of Australian Google Ads costs (2025) put average e-commerce CPC at A$1.82 and typical e-commerce monthly budgets at A$500 to A$5,000. That range is wide because the right figure depends entirely on your margin and AOV. A store with A$25 products can’t use the same budget as one selling A$400 furniture.
Step 3: Run the CPA Reality Check Before You Spend a Cent
Here’s the test most guides skip. Your actual CPA is not something you choose. It’s something your market gives you, and the maths is simple:
Expected CPA = Cost per click / Conversion rate
Use the Australian figure of A$1.82 for e-commerce CPC and see what different conversion rates do:
| Conversion rate | Expected CPA at A$1.82 CPC | Against A$40 target |
|---|---|---|
| 1.4% (average Shopping) | A$130 | 3.2x too high |
| 2.8% (average Search) | A$65 | 1.6x too high |
| 4.5% (strong Search, top quartile) | A$40 | On target |
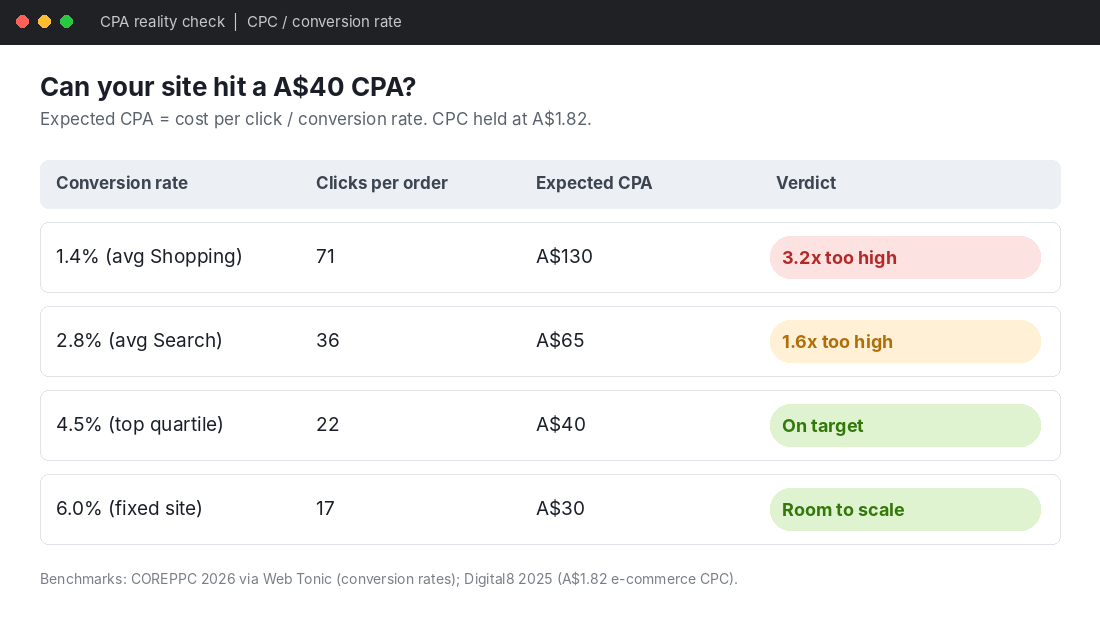
The conversion rates come from COREPPC’s 2026 benchmarks as reported by Web Tonic: an average Shopping conversion rate of 1.4%, an average Search conversion rate of 2.8%, and a Search range of 0.9% at the 25th percentile up to 4.5% at the 75th. Those benchmarks are mostly US-based, and the CPC is the Australian figure, so treat the table as a sanity check, not a forecast.
What does it tell you? If your site converts at the average, a A$40 CPA is out of reach on cold traffic. That isn’t a Google problem. It’s a conversion problem. Before you raise the budget, fix the page. Our walkthrough of Google Shopping product feed optimisation covers the feed issues that quietly drag conversion down, and the checkout and product page fixes in our conversion benchmarks work cover the rest.
The honest takeaway: a bigger budget on a leaky store just buys you more leaks. Spend the first month finding out where you sit.
Step 4: Split the Budget Across Campaign Types
Once you’ve got a monthly figure, divide it. The split below suits most Australian Shopify stores with a catalogue of 20 or more products. It matches the general pattern agencies recommend: most of the money in Shopping or Performance Max, a protected slice for your own brand name, and a smaller test slice for non-brand search.
| Campaign | Share of budget | Job |
|---|---|---|
| Shopping or Performance Max (products) | 55% | Captures buyers searching for product types |
| Brand search | 15% | Protects your name from competitors bidding on it |
| Non-brand search | 20% | Finds new customers by problem or category |
| Retargeting and tests | 10% | New formats, new product launches |
On our A$7,200 example, that’s A$3,960 for product campaigns, A$1,080 for brand, A$1,440 for non-brand and A$720 for tests.
A few rules that save money:
- Don’t launch all four at once on a small budget. Under A$2,000 a month, run product campaigns and brand search only.
- Brand search is cheap. Don’t skimp on it. If a competitor bids on your name, you pay for it twice: once in lost sales, once when you scramble to defend it.
- Performance Max needs a clean feed. Google says advertisers who moved from standard Shopping to Performance Max saw an average 25% increase in conversion value at a similar ROAS, based on global data from October 2022 to March 2023. That figure assumes decent product data. Garbage in, garbage out.
Our step-by-step guide to setting up Shopping campaigns on Shopify covers the build itself.
What Real Shopify Brands Reported
Take the following as merchant-reported results, not audited ones. They come from Shopify’s own write-up of its Google & YouTube channel, and they show what happens when a store connects its catalogue properly and gives the system a real budget.
- Pono Woodworks reported $12 in sales for every $1 spent on ads, with online sales up 106%.
- The Ollie World reported more than 4,000 new customers and a 28x return on ad spend over six months.
- Xena Workwear reported that more than 90% of the shoppers it reached were new customers, with up to an 8x return on ad spend.
Notice what’s missing: none of them promise that you’ll see these numbers. Treat them as proof the channel can work, not as a target. Your own break-even ROAS from Step 1 is the only target that matters.
The Tool: Set Up the Google & YouTube App on Shopify
If you haven’t connected your store properly yet, here’s the setup. The Shopify Google & YouTube app is free to install. Ad spend is billed separately by Google.
- Install the Google & YouTube app from the Shopify App Store.
- In your Shopify admin, go to Sales channels, then Google & YouTube, and click Connect Google Account.
- Choose the Google accounts to link: Merchant Center, Google Ads and, if you use it, Google Analytics.
- Wait for your products to sync to Google Merchant Center. Fix any disapprovals before you spend anything.
- Create your first Performance Max campaign and set the daily budget from your Step 2 number.
Before you launch, check your store meets Google’s basics. It can’t be password-protected, it needs a valid payment provider, a refund policy, terms of service and visible contact information. Missing any of these is the most common reason a new feed gets rejected.
Also confirm your conversion tracking is firing correctly before you spend. If Google can’t see which clicks became orders, it can’t optimise, and you’ll burn the learning budget for nothing. Our GA4 setup guide and tracking pixel audit show you how to check.
For ongoing budget decisions, Google’s Performance Planner can help you work out how to distribute budget across campaigns you’ve already got running. It needs live campaign history to work with, so it’s a month-two tool, not a day-one one.
Step 5: Know When to Scale and When to Hold
Scaling is where stores lose the profit they just built. A good rule: raise the budget by no more than 20% every 7 to 10 days, and only when three things are true.
- CPA is at or under target for at least two weeks running.
- The campaign has exited the learning phase and CPA isn’t swinging wildly week to week.
- Impression share is below about 80%. If you’re already showing for almost every relevant search, more budget just pushes you into worse auctions.
Cut or pause when CPA runs above break-even for three weeks with no change in the site, the offer or the feed. Don’t react to a single bad day. With Google allowed to spend up to double your daily budget, one expensive Tuesday tells you very little.
Seasonality matters too. Heading into Black Friday and Christmas, auctions get more competitive and CPCs rise, but conversion rates usually rise as well. Plan your November budget from last year’s numbers in your own account, not from a benchmark.
The Compound Effect: How the Pieces Work Together
Look at what we just built. Your margin sets your break-even CPA. Your CPA and your order goal set the budget. The budget sets how much data Google gets. More data lets the bidding learn. A cleaner feed and a faster, higher-converting site lower your CPA. A lower CPA gives you room to scale, which gives Google more data again.
That’s a loop, and it compounds. The stores that win on Google aren’t the ones with the biggest budgets. They’re the ones who fixed the weakest link first, then fed the loop.
The stores that lose do it in reverse. They guess a budget, skip the conversion check, spread thin across five campaigns, and read the noise as a verdict.
Your One-Page Google Ads Budget Template
Copy this into a spreadsheet and fill it in. It takes about ten minutes.
- Average order value: A$____
- Gross margin %: ____%
- Break-even CPA (AOV x margin): A$____
- Target CPA (about 60% of break-even): A$____
- Break-even ROAS (1 divided by margin): ____x
- Target orders from Google per month: ____
- Monthly budget (orders x target CPA x 1.2): A$____
- Daily budget (monthly budget divided by 30.4): A$____
- Expected CPA check (CPC divided by conversion rate): A$____
- Minimum conversions per campaign: 30 (50 for Target ROAS)
- Campaign split: 55% product, 15% brand, 20% non-brand, 10% tests
- Scale rule: +20% every 7 to 10 days, only if CPA is on target and impression share is under 80%
If line 9 comes out far above line 4, stop. Fix the site and the feed before you raise line 7.
Where to Go From Here
Inside eCommerce Circle, paid media budgeting is one of the core pillars we work on with every member, because it sits right between Profit and Promotion. If you want to see exactly where your store is being capped, take the free More Orders Scorecard. It takes two minutes and shows you which of the 10 P’s to fix first.
Sources: Australia Post 2026 eCommerce Report (via Australia Post and EightX summaries); Google Ads Help, “About average daily budget” and “About Smart Bidding”; Google Ads Help, Google Marketing Live 2023 retail update; COREPPC 2026 benchmarks as reported by Web Tonic; Digital8, “How Much Does Running Google Ads Cost In Australia?” (March 2025); Shopify, Google & YouTube channel guide. Benchmarks vary by category and currency, so confirm against your own account data.