Your customer acquisition cost is the total you spend on marketing and sales in a period divided by the number of brand-new customers you won in that same period. If you spent $12,000 and won 150 first-time buyers, your CAC is $80. Most Shopify founders get this number wrong because they divide by orders instead of new customers, or they trust the figure Meta shows them.
That mistake matters more every year. Australians spent a record $82.6 billion online in 2025, up 14% on the year before, according to the Australia Post eCommerce Report 2026. But the average basket is only $96, about $10 lower than in 2020. More buyers, smaller baskets, and the same ad auctions to win them. Your CAC is the number that tells you whether that maths still works for your store.
This guide gives you the formula, the three versions of CAC you need to track, honest benchmarks (with a warning about the dodgy ones), and a payback calculator you can build in ten minutes.
The Customer Acquisition Cost Formula for Shopify
The textbook formula is simple: CAC = (total marketing spend + total sales spend) / new customers acquired. The trouble is in what you put on each side.
On the top line, include everything it costs to win a customer. Not just ad spend. Add agency or freelancer fees, creative production (that UGC creator invoice counts), the portion of salaries spent on acquisition, email and ad tools, and any first-order discount you gave away. A 15% welcome code on a $90 order is a $13.50 acquisition cost, and most stores never count it.
On the bottom line, count new customers only. A customer who bought last year and came back through a Meta retargeting ad is not an acquisition. Orders are not customers either. If 150 new customers placed 190 orders in the month, you divide by 150.
- Monthly spend example: $9,000 ad spend + $1,500 agency + $700 creative + $800 tools and discounts = $12,000.
- New customers: 150 (from Shopify’s new vs returning report).
- CAC: $12,000 / 150 = $80.
Blended CAC vs Paid CAC vs New-Customer CAC
There is no single CAC. There are three, and each answers a different question. Polar Analytics describes blended CAC as the “truth anchor” for good reason: it is the one number your bank account agrees with.
- Blended CAC = total spend / all new customers, paid and organic together. Use it to judge whether the business is healthy.
- Paid CAC = paid spend / customers from paid channels. Use it to judge whether your ad budget is working.
- Platform CAC = what Meta or Google reports. Treat it as a hint, never a verdict.
The gap between them can be enormous. Polar Analytics cites one brand that saw $52 on its ad platform and a real blended CAC of $178 in the same week, a 3.4x gap. Platforms take credit for sales that would have happened anyway, and they count repeat buyers as conversions. If you run Meta, read our guide to Meta attribution settings before you trust any number inside Ads Manager.
Here is the rule we give members: make decisions on blended CAC, optimise on paid CAC, and ignore platform CAC unless it agrees with the other two.
Customer Acquisition Cost Benchmarks (and Which Ones to Ignore)
Search for CAC benchmarks and you will find numbers that contradict each other by a factor of ten. One roundup lists average retail CAC at $226 in one place and $10 in another. That is a sign the numbers are scraped, not measured.
Treat every benchmark as a sanity check against your own margin, not a target. With that caveat, these are the figures that came from sources with a stated method, mostly in US dollars:
| Source | Figure | What it tells you |
|---|---|---|
| Rivo (Shopify brand data) | Average ecommerce CAC about US$70, range US$53 to US$91+ | Food and beverage lowest (US$53), jewellery highest (US$91) |
| Swell (DTC categories) | Pet US$23, fashion US$37, beauty US$42, home US$45, supplements US$89 | Category and price point drive CAC more than store quality |
| Polar Analytics (2026, new-customer CAC) | Paid social US$40 to US$120, non-brand search US$50 to US$150, email and SMS US$5 to US$25 | Owned channels cost a fraction of paid |
| Rivo and Ecommerce Fastlane | LTV:CAC target of 3:1, with 2:1 or less near break-even | The floor most operators use |
Notice what is missing: an Australian number. There is no reliable public CAC benchmark for Aussie Shopify stores, because the figure depends on your margin, your category and how much you discount. Your own data beats any benchmark here. Our break-even ROAS guide shows how to turn your margin into a ceiling for what you can afford to pay.
The Ratio That Matters: LTV to CAC
A $60 CAC is fine for a store whose customers spend $400 over two years. It is a disaster for a store where customers buy once at $75. CAC only means something next to lifetime value.
LTV = average order value x orders per year x years retained. Ecommerce Fastlane’s worked example: a $50 order, 4 purchases a year, 3 years gives $600. Against a $200 CAC, that is a 3:1 ratio. Use gross margin, not revenue, for your own version, because revenue flatters you.
- Below 2:1 means you are close to break-even or losing money on each new customer.
- 2:1 to 3:1 works if cash flow is healthy and retention is improving.
- 3:1 to 4:1 is the classic healthy zone for ecommerce.
- 8:1 or higher often signals you are under-investing in growth, not that you are brilliant.
Be careful with LTV on stores under 12 months old. You do not have the repeat data yet, so use a 6-month figure and call it that. Our post on repeat customer rate benchmarks shows how to check whether your customers actually come back.
CAC Payback Period: The Number Cash-Flow-Constrained Stores Should Watch
LTV:CAC tells you whether acquisition is profitable eventually. Payback period tells you when you get your cash back. For a founder funding ads from a business account, that is the more painful question.
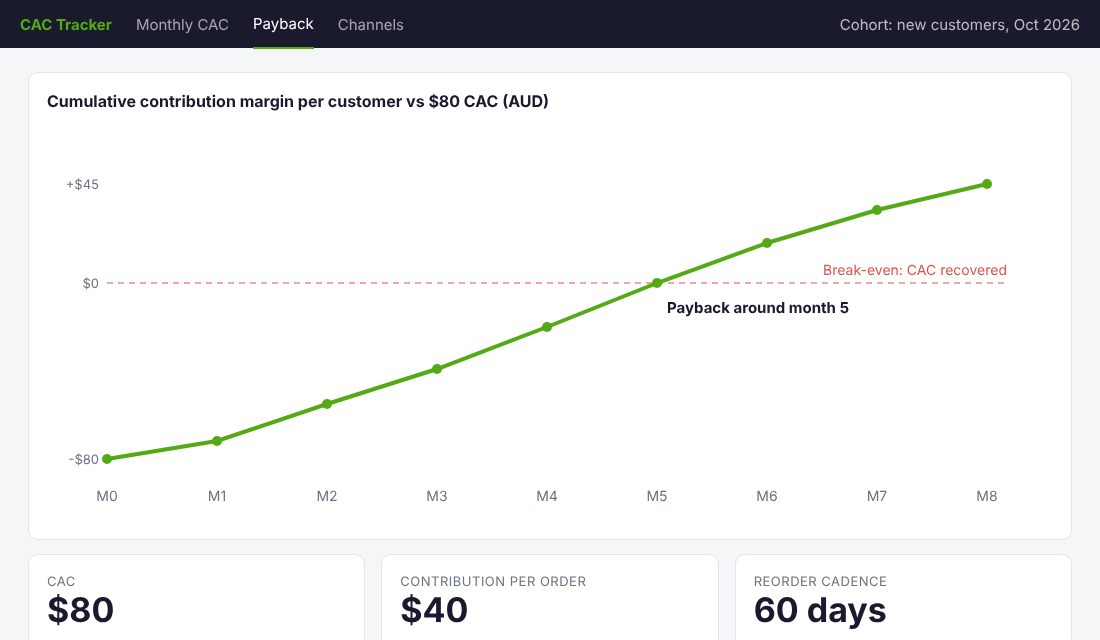
The formula, from Polar Analytics: orders needed = CAC / contribution margin per order. Then multiply by your average days between orders. Their example: $80 CAC with $40 contribution margin per order needs two orders; at a 60-day reorder cadence, that is about four months. Polar says three to six months is a reasonable payback target for most DTC brands.
Contribution margin is price minus product cost, shipping, payment fees and returns. If you have not worked out those fees, start with our breakdown of Shopify Payments fees in Australia. Skipping them overstates your margin by several points and makes your payback look faster than it is.
How to Calculate CAC in Shopify: Setup Steps
You do not need a paid tool to start. Use Shopify’s own reports plus a Google Sheet. If you later want automation, tools like Polar Analytics or Lifetimely calculate blended CAC and cohort LTV for you, but get the manual version right first so you understand what the tool is doing.
- Pull new customers. In Shopify admin go to Analytics, then Reports, and open the new vs returning customer report. Set the date range to a full calendar month and note the first-time customer count.
- Add up spend. Open a sheet with one row per month. Columns for Meta, Google, TikTok, email platform, agency, creative and tools. Pull the ad numbers from each platform’s billing page, not the dashboard.
- Add discount cost. Go to Analytics, then Reports, and open the discounts report. Filter to first orders if you can, and add the total as its own column.
- Calculate three CACs. Blended (total / new customers), paid (paid spend / new customers from paid) and platform-reported. Colour-code the gap between them.
- Add contribution margin per first order and divide CAC by it to get orders-to-payback.
- Review monthly. Set a calendar reminder for the 3rd of each month. Trend matters more than any single figure.
Four Ways to Lower CAC Without Cutting Your Ad Budget
Most advice on lowering CAC is “get better creative.” That works, but it is the slowest lever. These four move the number faster.
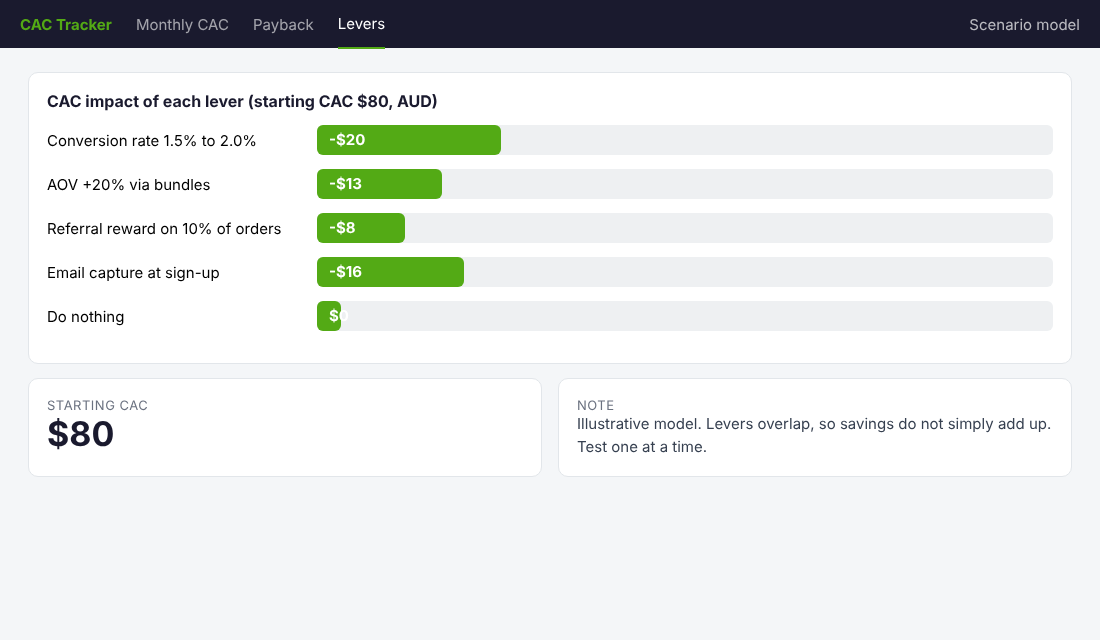
1. Lift conversion rate. CAC = cost per click / conversion rate. If your store converts at 1.5% and you lift it to 2%, CAC drops by a quarter with no change in ad cost. Product page, trust signals and shipping clarity are usually where the gains are.
2. Raise your average order value. A higher first-order value spreads the same CAC over more margin. Bundles are the cleanest way: see our guide to Shopify product bundles for pricing that lifts AOV without wrecking margin.
3. Build a referral loop. Native, the deodorant brand, tested referral rewards and found a free mini deodorant outperformed cash-style incentives, according to LEK Consulting’s analysis of DTC acquisition. A physical reward costs you product margin, not ad dollars, and brings in a customer pre-sold by a friend.
4. Collect data at sign-up. LEK notes Curology and Function of Beauty use detailed sign-up surveys to personalise offers, while Allbirds and Everlane use sign-up incentives to capture first-party data. Owned data lets you market to a visitor by email for under US$25 a customer (Polar’s range) rather than paying for the click again.
Why CAC Keeps Rising and What Smart Brands Did About It
Acquisition costs have been climbing for years. LEK Consulting reported that by Q4 2021 social CPMs were up 22% year on year and search CPCs up 23%, with only around a quarter of iOS users opting in to cross-app tracking after Apple’s 2021 privacy change. Different sources put the rise since 2023 anywhere from 16% to 60%, so treat any single figure with suspicion. The direction is not in doubt.
The brands that coped did not simply outspend the auction. Away used out-of-home advertising and Pinterest. Bombas partnered with Sesame Street. Dr. Squatch and Function of Beauty went into Walmart and Target to find customers cheaper than their own ads could. The common thread is diversification: when one channel gets expensive, they shift where the next customer comes from.
For a typical Aussie Shopify store with a $10,000 to $30,000 monthly ad budget, that does not mean Walmart. It means a second acquisition channel (Google Shopping or email capture), plus a stronger first-to-second-order path so each expensive customer is worth more. Our Shopify loyalty program guide covers the second part.
Five CAC Mistakes That Make Good Stores Look Broken
We see the same errors in almost every store audit. Fix these before you change a single ad.
Mistake 1: Dividing by orders. If returning customers make up 40% of your orders, your CAC looks 40% better than it is. Always divide by first-time customers.
Mistake 2: Ignoring the discount. A store that gives 15% off the first order and spends $60 on ads per customer has a real CAC well above $60. Add the discount to the top line every month, and see whether a free-shipping threshold would cost you less. Our guide to the free shipping threshold shows how to test that.
Mistake 3: Mixing time windows. Ads you run in October often convert in November. Using a single month is fine for a rough read, but for high-consideration products compare spend against a 28-day lag, or use a three-month rolling average.
Mistake 4: Using revenue LTV. A $600 revenue LTV at 45% gross margin is $270 of margin, not $600. A 3:1 ratio on revenue is closer to 1.35:1 on margin. That is the difference between growing and quietly losing money.
Mistake 5: Chasing a low CAC. The cheapest customers are often discount hunters who never come back. A $90 CAC that brings a customer worth $400 is better than a $40 CAC for a one-time $55 buyer. Optimise for the ratio and the payback, not the lowest figure.
A Worked Example for an Australian Store
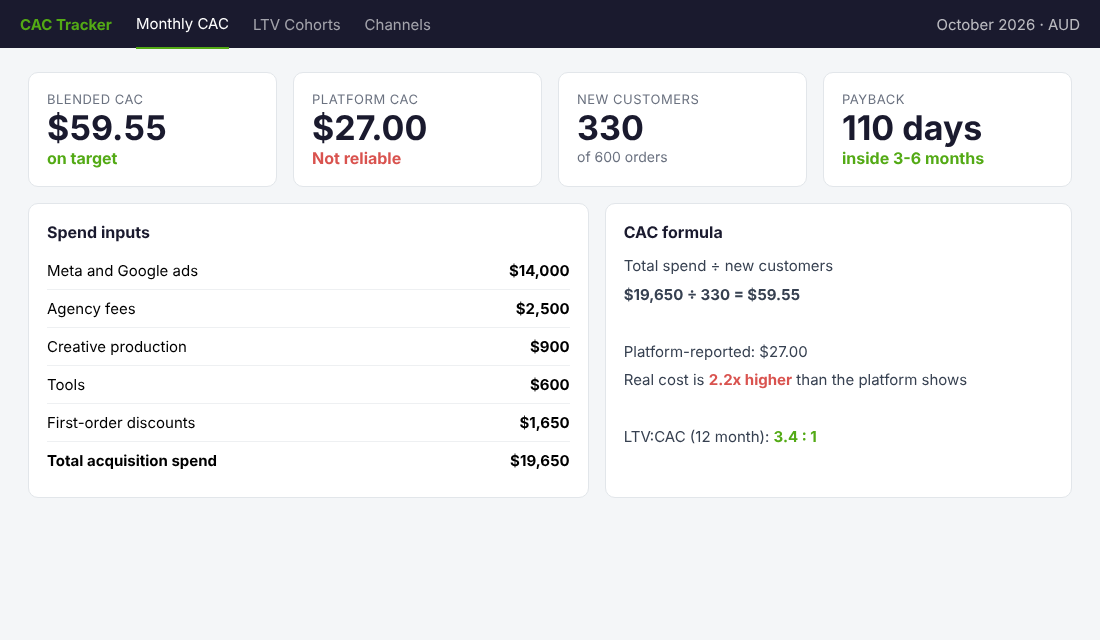
Picture a Melbourne homewares brand doing 600 orders a month. Shopify shows 330 of them are first-time customers. Spend for the month: $14,000 on Meta and Google, $2,500 on its agency, $900 on creative, $600 on tools and $1,650 in welcome discounts. Total: $19,650.
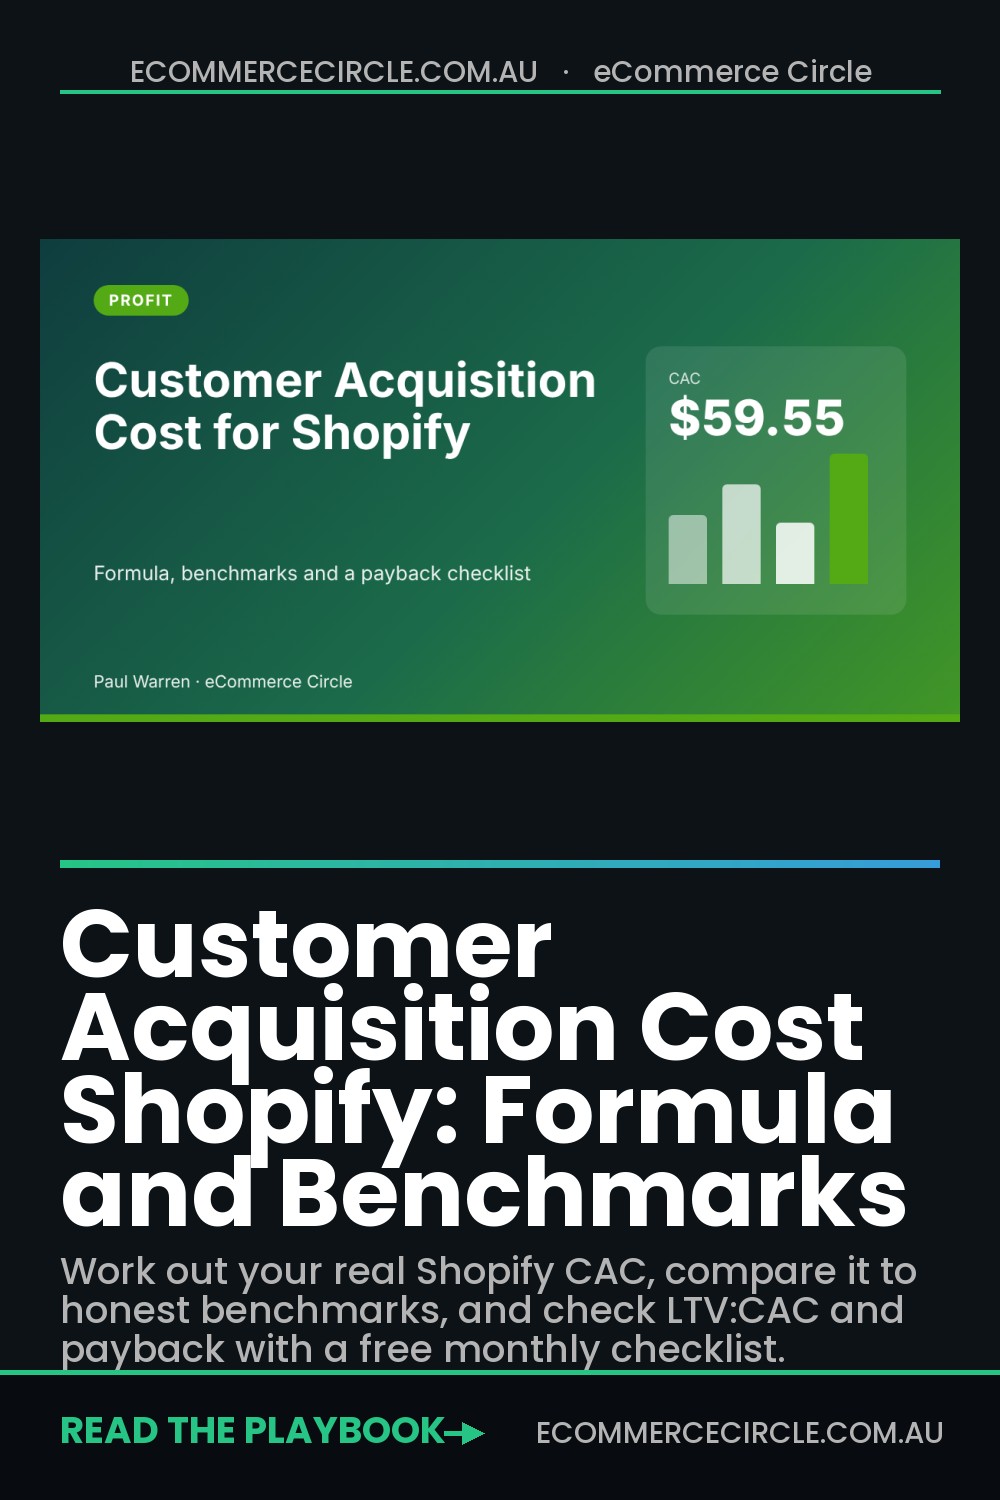
Blended CAC is $19,650 / 330 = $59.55. Meta says it generated 410 purchases at a $27 cost per result, which looks fantastic. But 410 includes returning buyers and sales that would have happened anyway. The platform number is less than half the real one. If the founder had scaled spend on the $27 figure, she would have been buying customers at more than twice the price she thought.
First-order AOV is $88, product cost and shipping take $41, and payment fees and returns take another $6, leaving $41 contribution. CAC / contribution = 1.45 orders to payback. If her reorder cadence is 75 days, payback lands around 110 days, comfortably inside the 3 to 6 month window. Her business is healthy, and the real problem is that she believed the wrong number. These figures are an illustrative example, not a benchmark.
The Compound Effect: How CAC, LTV and Payback Work as One System
Treat these as separate metrics and you will chase the wrong fix. Treat them as one system and the decisions get obvious.
Take a store at $80 CAC, $60 first-order AOV and 45% margin. Contribution on the first order is about $27 after shipping and fees, so payback needs three orders and roughly six months. Now apply three changes: lift conversion from 1.5% to 1.9% (CAC falls to about $63), lift AOV to $72 with a bundle (first-order contribution rises to about $32), and add a post-purchase email flow that gets 20% to reorder. Payback drops from six months to under four, and the ratio crosses 3:1. None of those changes needed more ad budget. That is the point: CAC is an output of the whole store, not just your ads. These example figures are illustrative; run your own numbers.
Your CAC Scorecard: A Monthly Checklist
Copy this into your sheet and fill it in on the 3rd of every month:
- Total acquisition spend (ads, agency, creative, tools, first-order discounts): $____
- New customers (Shopify new vs returning report): ____
- Blended CAC = spend / new customers: $____
- Paid CAC = paid spend / paid new customers: $____
- Platform-reported CAC (for the gap check): $____
- Contribution margin on first order: $____
- Orders to payback = blended CAC / contribution margin: ____
- Days to payback = orders x average reorder days: ____
- LTV:CAC (6-month or 12-month LTV, on gross margin): ____ : 1
- Red flag check: ratio under 2:1 or payback over 6 months? Yes / No
Inside eCommerce Circle, acquisition economics is one of the first things we fix with every member, because it decides how fast a store can safely grow. If you want to see exactly where your store is being capped, take the free More Orders Scorecard. It takes two minutes and shows you which of the 10 P’s to fix first.
Sources: Australia Post eCommerce Report 2026 (auspost.com.au); Rivo, Average Customer Acquisition Cost for eCommerce (Jan 2026); Polar Analytics, Customer Acquisition Cost guide; Ecommerce Fastlane, LTV to CAC ratio; LEK Consulting, Fighting rising direct-to-consumer customer acquisition costs; Ringly ecommerce CAC statistics 2026 (Swell category data, reliability varies by source).