Your Meta dashboard says 3.1x. Is that good? Most store owners can’t answer that with confidence, so they do one of two things. They Google “good ROAS”, land on a round number like 4x, and either panic or celebrate based on a figure that has nothing to do with their margins.
What’s in This Article
Both reactions are wrong. A 3.1x ROAS can lose money on a 35% margin product and print cash on a 70% margin one. The benchmark isn’t a universal number. It’s a band that depends on your industry, your margin, how Meta counts sales and, here in Australia, whether your reported revenue includes GST.
This guide gives you the real numbers first: median Meta ROAS across more than 40,000 brands, the industry spread, and the Australian cost data sitting behind the ratio. Then it gives you the part benchmark posts skip, a five-step method for turning those numbers into a floor, a target and a stretch goal that fit your store.
What Is a Good ROAS on Meta Ads? The Short Answer
Start with the biggest dataset available. Triple Whale analysed more than 40,000 brands for August 2025 to July 2026 and found a median Meta ROAS of 1.88, with a median CPA of US$38.99, a median CPM of US$15.06, a median click-through rate of 2.39% and a median conversion rate of 1.53%. That ROAS figure was up just 0.57% on the year before.
Now compare that with what you’ll read elsewhere. Zentric Digital puts the ecommerce average at 2.87x and says a top-quartile store sits between 4.0x and 5.5x, using public industry data and its own client portfolio. An Australian agency, Performance Marketer, recommends 2:1 to 3:1 on cold prospecting and 5:1 or more on retargeting. These aren’t contradicting each other. They’re measuring different things.
The Triple Whale number is a median across every kind of store, including brands that run weak campaigns. Agency numbers skew toward managed accounts with professional creative. Retargeting figures flatter the average because those buyers were already halfway to the checkout. So here’s the working answer:
- Below 1.5x: you’re in the bottom tier for most categories. Something is broken in the offer, the creative or the tracking.
- 1.8x to 2.5x: typical. About where the middle of the market sits, and fine only if your margin supports it.
- 3x to 4x: strong for a store spending real money. This is where well-run brands with good creative tend to land on blended prospecting plus retargeting.
- 5x and above: usually retargeting-heavy accounts, small budgets or brands in high-margin categories. Check it isn’t coming from people who would have bought anyway.
None of those bands tell you whether you’re profitable. They tell you where you sit against the field. Profit comes later in this article.
Meta ROAS Benchmarks by Industry
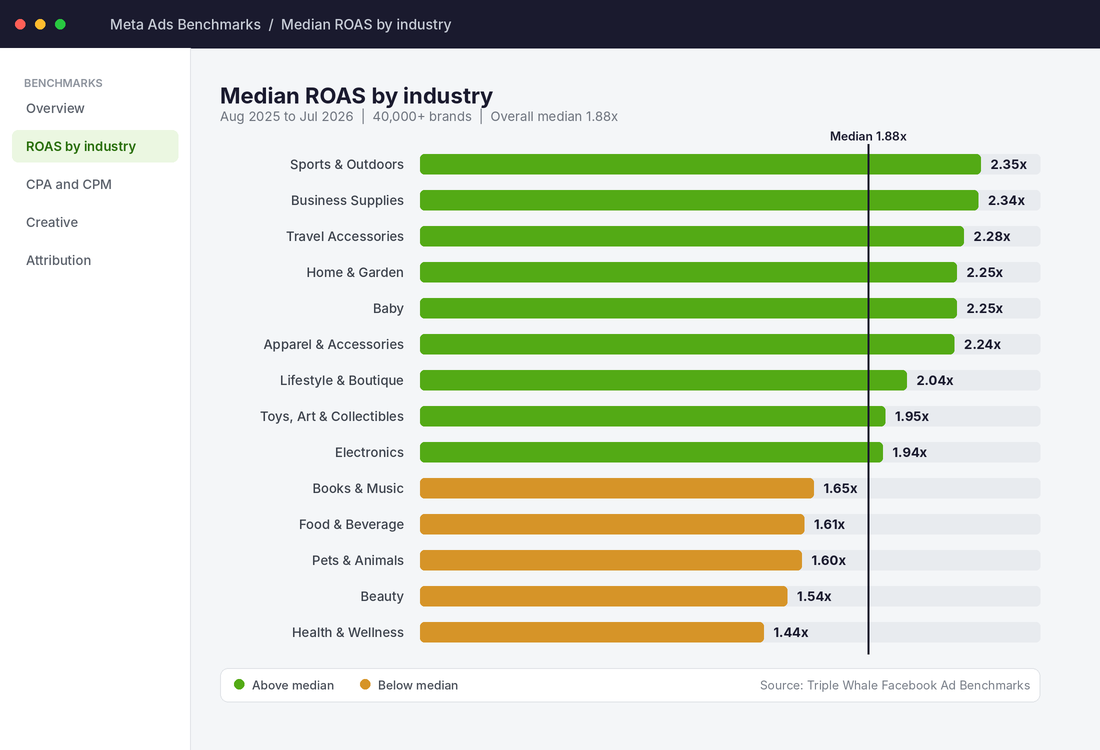
Category matters more than most owners expect. A beauty brand and a sports gear store can both run excellent campaigns and still report very different ratios, because average order value, repeat purchase rates and product margins differ so much. Here is Triple Whale’s median ROAS by industry for the same August 2025 to July 2026 window, with the year-on-year change.
| Industry | Median ROAS | Change vs prior year |
|---|---|---|
| Sports & Outdoors | 2.35 | +5.02% |
| Home & Garden | 2.25 | +6.04% |
| Baby | 2.25 | +4.20% |
| Apparel & Accessories | 2.24 | +4.76% |
| Toys, Art & Collectibles | 1.95 | +2.04% |
| Electronics | 1.94 | -1.31% |
| Food & Beverage | 1.61 | +7.08% |
| Pets & Animals | 1.60 | +2.50% |
| Beauty | 1.54 | -3.59% |
| Health & Wellness | 1.44 | -8.47% |
Two patterns jump out. First, the categories with the lowest ROAS, health and wellness, beauty and food, are the ones with the strongest repeat purchase behaviour. Brands in those categories accept a weaker first-order return because the second, third and fourth orders carry the profit. Second, health and wellness fell 8.47% in a year while CPM in that vertical sat at the highest of any category, US$21.80 per thousand impressions.
If you sell apparel, home goods or sports gear, a 2.2x to 2.4x median is your reference point. If you sell beauty, supplements or consumables, judge yourself against 1.4x to 1.6x on first-order ROAS, then check the repeat rate. That’s the context a headline benchmark never gives you.
One more caution. These are US-dollar figures from a global dataset, and they measure platform-reported ROAS. Australian stores face different costs, different shipping economics and a 10% GST layer inside the revenue number. The next two sections deal with exactly that.
Why Benchmarks Mislead: Attribution, GST and Mix
Before you compare your dashboard to anyone’s chart, three things can quietly distort the number you’re looking at.
1. Meta changed how it counts sales in January 2026
On 12 January 2026, Meta removed the 7-day view and 28-day view attribution windows from its Ads Insights API, along with combined windows that used them. What’s left: 1-day view, 1-day click, 7-day click, and 28-day click for reporting only. Dataslayer notes that industry data showed some advertisers were getting 30 to 40% of reported conversions from that longer 8 to 28 day window.
The practical effect is simple. If you’re comparing this month’s ROAS to a screenshot from 2025, or to a benchmark built on older windows, you aren’t comparing like with like. Your ads didn’t suddenly get worse. The accounting tightened. Pick one attribution setting, 7-day click is the safest default, and benchmark yourself against it consistently.
2. GST sits inside your reported revenue
Shopify stores selling to Australian customers usually show GST-inclusive prices. Meta reports the purchase value it receives, which means your reported ROAS includes the 10% GST you’ll hand straight to the ATO. A reported 3.0x is really about 2.73x on ex-GST revenue. Most overseas benchmarks don’t carry this layer, so a US store at 2.5x isn’t directly comparable to an Aussie store at 2.5x. You’ll see the full worked example in step 1.
3. Your blend of campaign types changes everything
A store spending 40% on retargeting will report a much higher ROAS than a store spending 10%, with identical creative quality. Retargeting audiences are small, warm and cheap to convert. The Performance Marketer team puts typical retargeting at 5:1 or better and cold prospecting at 2:1 to 3:1. If you don’t split ROAS by campaign type, you’ll compare your blended number to a benchmark that’s mostly cold traffic and wrongly conclude you’re winning.
The Australian Costs Behind the Ratio
ROAS is revenue divided by spend, so it moves with every cost between the impression and the sale. For Australian advertisers, the 2026 numbers look like this, according to RockingWeb’s Meta Ads Australia benchmarks (citing WordStream AU, Q1 2026, 8,400+ accounts):
- Blended CPM: A$9.80, up from A$8.60 in 2025. Instagram Feed runs about A$11.40 and Facebook Feed A$8.90, while Reels sits near A$6.20 to A$6.30.
- Average CPC for retail and ecommerce: A$1.20 with a 1.31% click-through rate. The all-industry average CPC is A$1.47, up 12% year on year.
- Cost per purchase for ecommerce: A$28.40 across all verticals.
Treat those as directional. Other Australian agency reports put CPM anywhere from A$10 to A$25 depending on audience and objective, and RedPandas notes Meta’s own Q2 2026 results show average price per ad up 12% year on year globally. Whichever source you trust, the direction is the same: it costs more every year to buy the same impression.
Seasonality hits harder. Influee reports Q4 CPMs run 25 to 50% or more above Q1 for ecommerce audiences. If your Q1 ROAS was 3.0x and your creative, offer and conversion rate stay identical into Black Friday, expect the number to fall as CPMs climb. That doesn’t mean your ads broke. It means your target ROAS needs a seasonal adjustment, which is covered in our Meta ads budget guide.
What a healthy Australian brand looks like at scale
Adore Beauty is a useful reality check because it’s listed on the ASX and publishes its numbers. In FY26 it reported revenue of A$207.3 million, cut marketing and advertising spend 22.8% to A$18.4 million, and reduced customer acquisition cost 37.4% to A$35.20 per customer, while still adding 418,600 new customers. Marketing spend works out to roughly 8.9% of revenue (that’s our calculation from their reported figures, not a number they published).
The lesson isn’t to copy their spend. It’s that the best-run brands watch cost per new customer and total marketing as a percentage of revenue, not just the ROAS number inside Ads Manager. Their 538,000 active loyalty members drove 81% of sales, which is why they can accept a modest first-order return and still grow profitably. Retention does the heavy lifting that ROAS can’t show.
Step 1: Work Out Your Own Break-Even ROAS
Everything in this article hangs on one calculation. Your break-even ROAS is the return at which a Meta order covers its own product cost, fulfilment and fees, and leaves nothing for profit. Below it you’re paying to sell. Above it you’re making money before overheads.
The formula most guides use is break-even ROAS = 1 / gross margin. It’s a decent starting point, but it misses GST and fulfilment costs. Here’s the fuller version for an Australian store, with a worked example on a $100 GST-inclusive product:
- Strip out GST. $100 shelf price divided by 1.1 gives $90.91 of real revenue. The other $9.09 belongs to the ATO.
- List variable costs per order. Product cost at 40% of ex-GST revenue is $36.36, shipping and packaging $9.00, payment fees $2.20. Total $47.56.
- Calculate contribution before ads. $90.91 minus $47.56 is $43.35, or 47.7% of ex-GST revenue.
- Divide to get break-even. $90.91 / $43.35 = 2.10x on ex-GST revenue. But Meta reports the GST-inclusive $100, so the break-even you’ll see in Ads Manager is $100 / $43.35 = 2.31x.
- Add your profit target. Want $10 profit per order? Maximum ad cost is $33.35, so your target on the dashboard is $100 / $33.35 = 3.00x.
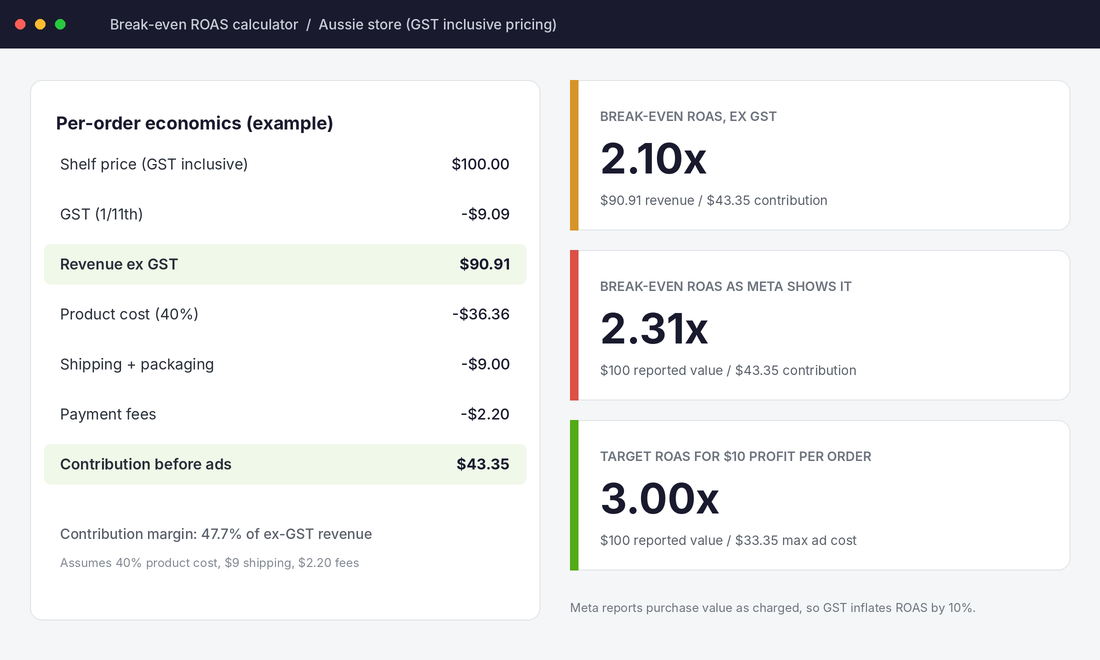
Now compare that to the benchmark. Triple Whale’s overall median is 1.88x. On this margin structure, the median brand is paying to acquire customers on the first order. That’s not a failure if repeat purchases follow, but it’s the reason “good ROAS” is meaningless without your own break-even sitting beside it.
If your margin is thinner than 47.7%, your break-even climbs fast. A 30% contribution margin pushes break-even above 3.3x. If you don’t know your contribution margin yet, start with our marginal ROAS playbook before you touch another budget. The Performance section of the free More Orders Scorecard also checks that you’re tracking these numbers at all.
Step 2: Set a Floor, a Target and a Stretch Goal
A single ROAS goal fails because it asks one number to do three jobs. Replace it with three, anchored to your break-even.
| Level | How to set it | Using the $100 example |
|---|---|---|
| Floor | Break-even ROAS plus 10%. Below this for 7 days, you cut or fix. | 2.5x |
| Target | The ROAS that delivers your profit per order. Run at this by default. | 3.0x |
| Stretch | Target plus 30%. Hitting it means you can probably spend more. | 3.9x |
Then set separate targets by campaign type, because they behave differently:
- Cold prospecting: expect to run closer to your floor. Its job is finding new customers, and a weaker first-order return is acceptable if lifetime value supports it.
- Retargeting: should clear the stretch number easily. If it doesn’t, the audience is too broad or your site is leaking. Cap it at roughly a quarter of total spend so a flattering ratio doesn’t hide expensive prospecting.
- Advantage+ shopping campaigns: judge these on blended results since Meta mixes new and existing customers inside them. True Classic’s president reported more than half its Meta spend sat in Advantage+ shopping campaigns and a 10% ROAS lift (Modern Retail, January 2023). That’s dated and self-reported, so use it as a signal of how brands treat the format, not as a target.
Our Meta ads budget guide covers how much to put behind each layer once you know these numbers.
Step 3: Reconcile Platform ROAS With MER
Meta marks its own homework. If a customer sees a Meta ad on Monday, clicks a Google ad on Wednesday and buys on Thursday, both platforms can claim the sale. Add together platform-reported revenue and you can easily exceed what Shopify actually banked.
The fix is a number Meta can’t inflate: MER, or marketing efficiency ratio. It’s your total net sales divided by your total ad spend across every channel. It ignores attribution entirely. If Meta says 3.4x but your MER is 2.1x, someone is double counting. Our blended ROAS playbook walks through reconciling the two, and it explains why more Australian brands now steer by MER.
Tool setup: a 20-minute weekly tracker (free)
You don’t need expensive software. A Google Sheet and Ads Manager do the job. If you later want automation, tools like Triple Whale or Northbeam pull the same numbers into one dashboard, but the manual version teaches you what each number means first.
- Fix your attribution setting. In Ads Manager, open Columns and use the compare attribution settings option to view 7-day click alongside 1-day click. Pick 7-day click as your reporting standard and write it at the top of your sheet.
- Add the right columns. Show Amount spent, Purchases, Purchases conversion value and Purchase ROAS. Split by campaign so cold and retargeting are separate rows.
- Pull Shopify net sales. Use the net sales figure from Shopify’s analytics for the same Monday to Sunday week. Net sales excludes tax, which is what you want for MER.
- Log total ad spend. Meta plus Google plus TikTok plus any creator fees you treat as paid media.
- Calculate three ratios. Meta ROAS, MER (net sales / total ad spend) and new customer share. Compare each to your floor, target and stretch from step 2.
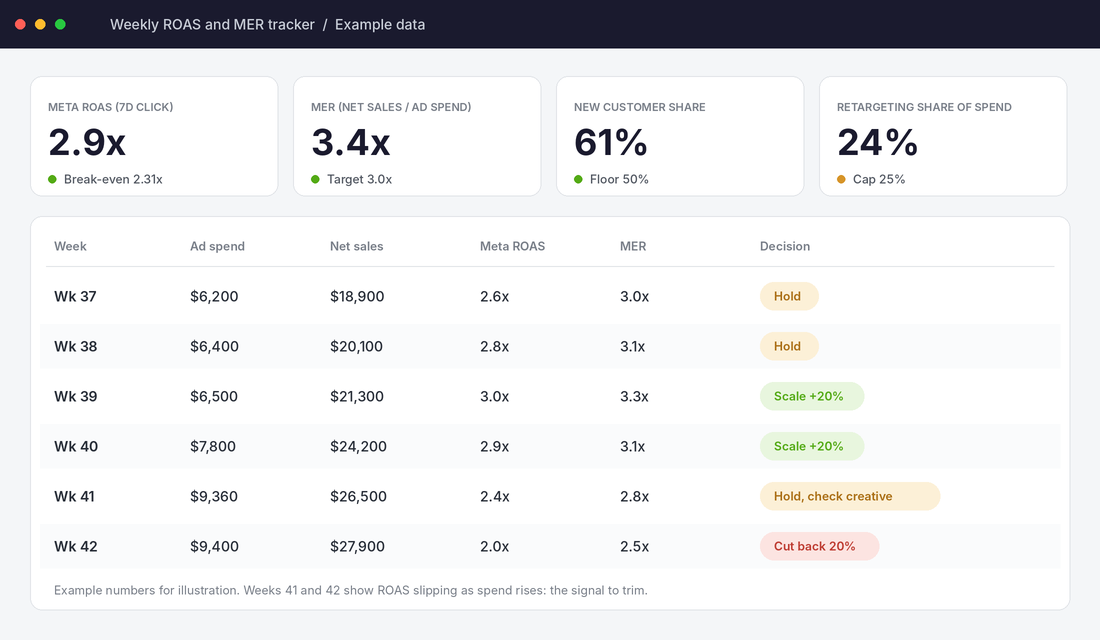
The tracker above uses example numbers, but notice what the pattern shows. In weeks 41 and 42, spend rises and ROAS slides from 2.9x to 2.0x. A store watching only revenue would see sales climbing and keep pushing. A store watching MER and ROAS sees diminishing returns and trims before margin disappears.
Step 4: Apply Weekly Decision Rules
A benchmark only earns its keep if it changes what you do on Monday morning. These rules remove the guesswork and the emotional reactions.
| Signal (7-day click, 7 days of data) | Action |
|---|---|
| ROAS above stretch and MER above target | Raise budget by about 20%, then wait 3 to 4 days before moving again. |
| ROAS between target and stretch | Hold. Test new creative at the same spend. |
| ROAS between floor and target | Hold budget. Review creative, offer and landing page before scaling. |
| ROAS below floor for a full week, MER falling | Cut spend by 20% on the weakest ad sets. Do not switch everything off. |
| ROAS below break-even for 2 weeks | Pause the campaign and audit tracking, offer and creative before restarting. |
| Meta ROAS high but MER flat or falling | Suspect double counting or retargeting inflation. Audit before scaling. |
A few guardrails make these rules work. Wait for enough data, ideally 50 or more purchases per campaign before drawing firm conclusions, otherwise you’re reacting to noise. Make changes in steps of around 20% so you don’t push campaigns back into the learning phase. And compare like with like: don’t judge a November week against a February target.
If your ROAS keeps falling short even when you follow these rules, the problem is usually upstream of the benchmark. Look at creative fatigue, landing page mismatch and weak offers before you touch the budget.
The Compound Effect: How the Four Numbers Work Together
Each step on its own helps a little. Together they change how you run the account.
Your break-even ROAS keeps you honest about margin and GST. The floor, target and stretch turn one vague goal into three decisions. MER stops Meta’s attribution from flattering you. The weekly rules take emotion out of scaling. Add them up and you get an account where every dollar of budget has a job and a threshold.
Here’s the part most store owners miss. When you know your numbers, you can spend more confidently and for longer. The brand that knows its break-even is 2.31x can push budget aggressively at 3.0x. The brand that only knows “4x is good” either under-spends on a profitable account or over-spends on a losing one. Over a year, that gap in confidence is often the gap between a stalled channel and a compounding one.
Adore Beauty’s results show the bigger picture. Cutting marketing spend by nearly a quarter while adding new customers and lowering acquisition cost only happens when a business watches cost per customer, retention and total marketing share, not a single ROAS figure.
Your Meta ROAS Benchmark Checklist
Copy this into your weekly review. It takes about 20 minutes once the sheet is set up.
- I know my contribution margin per order, ex-GST, after product cost, shipping and payment fees.
- I’ve calculated break-even ROAS using the GST-inclusive revenue Meta reports (not the simple 1 / margin formula).
- I have a floor, a target and a stretch ROAS written down.
- My attribution setting is fixed at 7-day click and I haven’t switched it mid-month.
- Cold prospecting and retargeting are reported separately, and retargeting is capped at about 25% of spend.
- I calculate MER every week (net sales / total ad spend) and compare it to Meta ROAS.
- I use a written rule to scale, hold or cut, and I only change budgets by about 20% at a time.
- I adjust my target for Q4 CPM inflation instead of assuming last quarter’s ROAS will hold.
Inside eCommerce Circle, ad profitability is one of the core pillars we work on with every member. If you want to see exactly where your store is being capped, take the free More Orders Scorecard. It takes two minutes and shows you which of the 10 P’s to fix first.
Sources
- Triple Whale, Facebook Ad Benchmarks by Industry (40,000+ brands, August 2025 to July 2026)
- Zentric Digital, Meta Ads ROAS Benchmarks 2026 (25 April 2026)
- RockingWeb, Meta Ads Australia Benchmarks 2026 (citing WordStream AU, Q1 2026)
- Performance Marketer, What Actually Works on Meta Ads in 2026 (Australian Brands) (18 May 2026)
- Dataslayer, Meta Ads Attribution Window Changes 2026
- RedPandas Digital, How Much Do Facebook Ads Cost in Australia? (updated 4 September 2026)
- Influee, What Is a Good CPM for Facebook Ads? (13 July 2026)
- Small Caps, Adore Beauty Group FY26 results
- Modern Retail, Some e-commerce brands find Meta’s Advantage+ shopping ad tech to be a quiet hit (27 January 2023)