The average online cart is abandoned about 70% of the time. Baymard Institute’s average across 50 studies is 70.22%, and the range runs from 55% to 84%, so if your Shopify store sits near 70% you are normal, not broken.
Normal is still expensive. Every 100 carts you pay to create (ads, email, content, time) lose around 70 buyers before they pay. Most Aussie founders respond by blasting a 10% discount code at everyone who leaves. That treats the wrong problem. The top reasons shoppers give are extra costs, slow delivery and a checkout that asks too much, and a discount code only fixes one of those.
This guide gives you the benchmarks (global and Australian, with the year on every study so you know how far to trust it), the real reasons shoppers leave, nine fixes in the order I would do them, a recovery sequence with current Klaviyo numbers, and a one-page leak audit you can run on your own store in five minutes.
How to Calculate Your Cart Abandonment Rate (and Which Number to Trust)
The formula is simple: cart abandonment rate = 1 minus (completed orders divided by carts created), times 100. If 5,000 people add to cart in a month and 1,500 complete an order, your cart abandonment rate is 70%.
The mistake is stopping at one number. Your Shopify conversion funnel (Analytics, then the online store conversion funnel report) splits the journey into three steps: added to cart, reached checkout and completed checkout. Track the two gaps separately, because they have different causes and different fixes.
- Cart to checkout drop-off: shoppers who added to cart but never started checkout. This is mostly price shock, shipping uncertainty and people using the cart as a wishlist.
- Checkout to order drop-off: shoppers who started checkout and stopped. This is mostly form friction, missing payment methods, trust and errors. It is also where you can recover the most revenue, because these people typed an email address and were close to buying.
- Abandoned checkouts in your admin: Orders, then Abandoned checkouts, lists everyone who entered contact details and left. That is your recovery email audience.
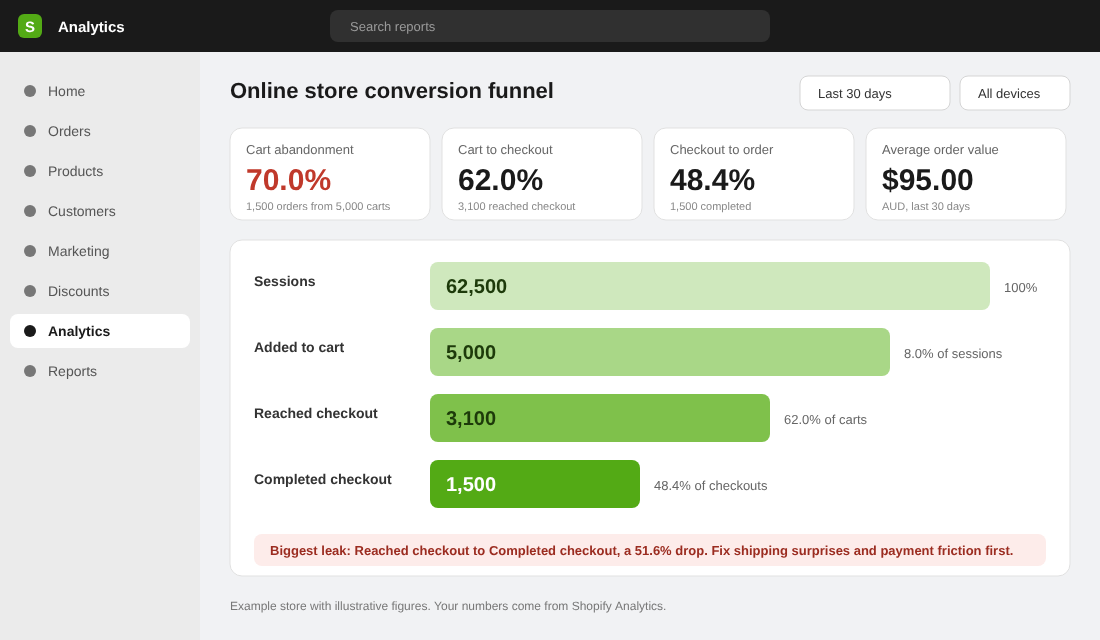
Here is what a fix is worth in dollars. Take a store with 5,000 carts a month, a 70% abandonment rate and a $95 average order value. That is 1,500 orders, or $142,500. Cut abandonment from 70% to 65% and you get 1,750 orders, which is 250 extra orders and $23,750 a month from the same traffic. That is illustrative arithmetic, not a forecast, but it shows why five points is worth more than another round of ad creative.
One reality check before you chase zero. Baymard’s survey found that around four in ten shoppers who abandoned an order said they were just browsing and not ready to buy. You will never recover those people. Baymard estimates large sites could lift conversion by 35.26% by fixing solvable checkout problems, which is the realistic prize. Chase that slice, not the whole 70%.
Cart Abandonment Rate Benchmarks: Global and Australian
Here is the honest position on Australian data: I could not find a current, independent Australian cart abandonment rate, and I am not going to invent one. What exists is a strong global baseline and a handful of Australian studies, most of them a few years old. Use them as directional guides and trust your own funnel over any of them.
| Metric | Figure | Source and year |
|---|---|---|
| Average cart abandonment rate | 70.22% (range 55% to 84%) | Baymard Institute, average of 50 studies, 2006 to 2025 |
| Mobile cart abandonment rate | 80.39% (global) | Dynamic Yield, cited in a 2026 Marketix Digital roundup |
| Desktop vs mobile conversion | Desktop converts 23% better (global) | Boston Consulting Group and Shopify, cited by Marketix Digital |
| Aussie shoppers who abandon carts sometimes or always | 57%, vs 47% in North America and 41% in Europe | SAP Consumer Propensity Study, 1,000 Australian respondents, 2018 |
| Abandoners who got a follow-up email | 76% received one, and 13% of those went back and bought | Power Retail Switched On Trajectory, 2021 |
| Abandoned cart email revenue per recipient | $6.77 average, $13.70 top 10% of flows | Klaviyo 2026 benchmarks, 110,000+ customers |
Two things stand out. First, mobile is the bigger problem: roughly eight in ten mobile carts are abandoned, and a growing share of your traffic arrives on a phone. Second, the Australian signal points the same way as the global one. The SAP study found Aussies were more likely than North Americans or Europeans to abandon carts at least sometimes, which fits the SAP finding that nearly half of respondents use carts to compare prices across brands and websites: Australian shoppers compare prices across tabs, and they punish shipping surprises.
For context on how your abandonment sits against the rest of your funnel, check it next to your Shopify conversion rate benchmarks and your add to cart rate. A store with a high add to cart rate and a high abandonment rate has a checkout problem. A store with a low add to cart rate has a product page problem, and that needs a different fix.
Why Australian Shoppers Leave Before Paying
Baymard asks US shoppers why they abandoned their last order. Strip out the people who were just browsing and the top reasons are below.
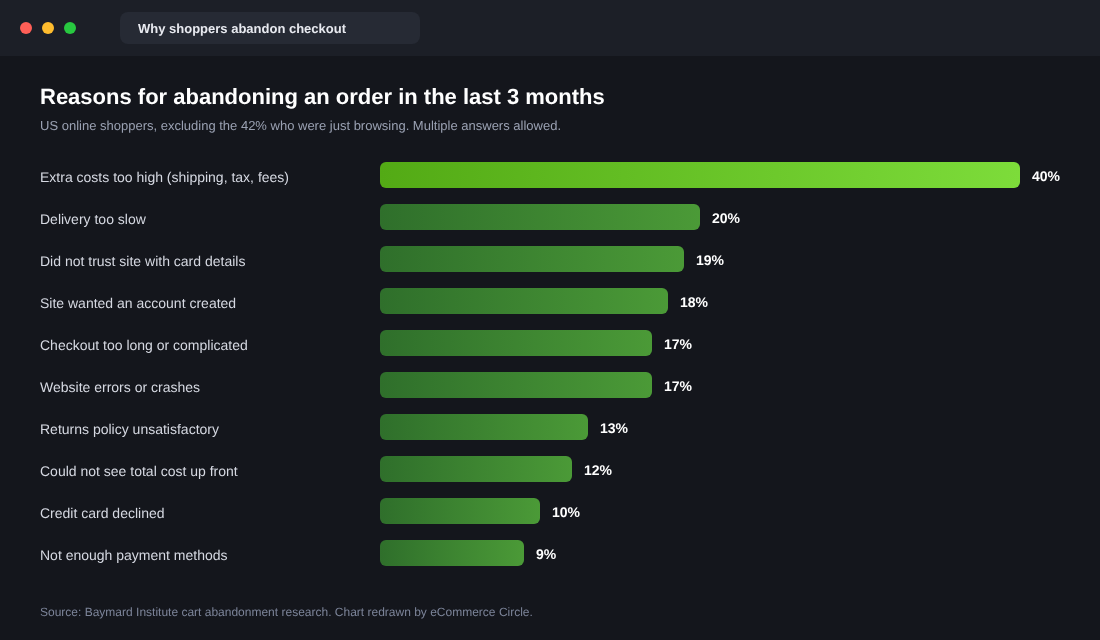
The Australian evidence lines up. Adyen’s Future of Australian Retail study (2017) found the top reasons Australians abandon were high delivery fees (52%), long online payment processes (32%), limited relevant payment options (31%), security worries (30%) and unexpected charges (27%). Power Retail’s 2021 survey of Australian shoppers was starker: 96% said excessive delivery fees would make them abandon, and 86% said finding out about delivery costs too late in checkout was a reason to leave.
Notice what is missing from both lists: the discount code. Shoppers do not say “I would have bought if it were 10% cheaper.” They say the total was higher than they expected, the checkout was a hassle, or they did not trust it. Those are design and policy problems, and you fix them once instead of paying for them on every order.
The newest Australian data point comes from the 2026 Australia Post eCommerce Report: 69% of shoppers want delivery options available during checkout, and 85% see reliable delivery as the most important trust factor when buying online (CommBank’s summary of the same report). Delivery is not a logistics topic. It is a conversion topic.
The 9 Fixes, in the Order to Do Them
I have ordered these by a simple rule: biggest documented cause first, then cheapest to implement. Do the first three this week and you will have covered the reasons behind most abandonments.
Fix 1: Show the Delivery Cost Before the Cart
Baymard found 43% of ecommerce sites show no shipping cost or calculator on the product page, yet 64% of test users looked for shipping costs there before deciding to add to cart. Separately, 21% of US shoppers abandoned an order in the last quarter because they could not see the total cost up front.
Baymard ranks the options from best to worst: flat-rate shipping you can state outright, then a location-based estimate, then a price range. Flat rate wins for most Aussie stores. A line under the add to cart button that reads “Free shipping over $99, otherwise $9.95 Australia-wide” removes the biggest surprise in the funnel. Add the same line to the cart page and your announcement bar. If your rates are complicated, our Shopify shipping policy template helps you simplify them into wording you can show.
Fix 2: Set a Free Shipping Threshold That Moves the Cart
A threshold turns shipping from a deterrent into a goal. As a rule of thumb, set it 20% to 30% above your current average order value, then watch average order value and abandonment together for two weeks. Too low and you give away margin. Too high and it becomes the thing shoppers resent. Our guide on setting a free shipping threshold walks through the maths, and a free shipping progress bar in the cart drawer (most modern Shopify themes include one) makes the target visible.
Fix 3: Turn On Express Checkout Everywhere
Accelerated checkouts (Shop Pay, Apple Pay, Google Pay, PayPal) skip the form entirely, and the form is where most checkout abandonment happens. Shopify claims Shop Pay can lift conversion by as much as 50% versus guest checkout. That is a vendor figure, so treat it as a ceiling, but the brand-level results are real.
- Princess Polly (Australian fashion brand) enabled Shop Pay’s authenticated checkout, which recognises returning Shop Pay users and signs them in automatically. In Shopify’s case study the result was a 4.1% conversion lift for buyers with an existing Shop Pay session, a 1% increase in Australian store orders and a 7.6% reduction in median checkout completion time.
- MORI (baby clothing) found about 55% of its customers use Shop Pay, and Shop Pay users converted 8.5% better. When MORI considered moving to a cheaper payment processor, the risk of losing Shop Pay kept it on Shopify Payments, because the conversion lift outweighed the fee savings.
Setup takes minutes. In Shopify, go to Settings, then Payments, and make sure Shopify Payments is active so Shop Pay, Apple Pay and Google Pay are available. Then check your theme (Online Store, Customize) to confirm the express checkout buttons show on the product page, the cart page and the cart drawer, not only at the checkout. Run a test order on your phone to see them as a customer does.
Fix 4: Offer the Payment Methods Aussies Actually Use
Limited payment options drove 31% of Australian abandonments in the Adyen study, against 9% in Baymard’s US data, which says something about how much Australians expect choice. PayPal’s eCommerce Index found 37% of Australians use buy now pay later, up from 26% the year before (cited by Marketix Digital). Adding a BNPL option usually means the right fit rather than every provider, because each one charges a merchant fee. We break the fee against the lift in Afterpay for Shopify: Is the Merchant Fee Worth It?. Pick one or two, and put the instalment amount on the product page so it does its job before checkout.
Fix 5: Make Guest Checkout the Default
18% of abandoners in Baymard’s survey left because the site wanted them to create an account. Check your customer account settings in the Shopify admin and confirm accounts are optional, not required. Better still, invite buyers to create an account on the order confirmation page, once they have already paid. You keep the data, and you lose nobody.
Fix 6: Cut the Fields
The average US checkout shows 23.48 form elements by default. Baymard’s ideal is 12 to 14. Defaulting billing address to “same as shipping” alone can reduce visible fields by 30% to 40%. In Shopify, go to Settings, then Checkout and trim what you can: hide company name, make address line 2 optional or hidden, hide the shipping address phone number unless your courier needs it, and require only the fields you use to fulfil the order. Every field you remove is one fewer reason to stop on a phone keyboard.
Fix 7: Put Trust and Returns Next to the Buy Button
Security concerns drove 30% of Australian abandonments in the Adyen study and 19% in Baymard’s survey, and an unsatisfactory returns policy was a reason for another 13%. You do not fix this with a padlock graphic. You fix it with plain information shoppers can find without leaving the page: payment icons, a one-line returns promise (“30-day returns, free exchanges”), a visible contact method, and real reviews near the price. If your returns wording is vague, use our Shopify returns policy template with the Australian Consumer Law rules to tighten it.
Fix 8: Promise a Delivery Date, Not a Range
Slow delivery was the second biggest reason in Baymard’s survey at 20%. You cannot always speed up delivery, but you can make it clear. Name your shipping rates with timeframes (“Standard, 3 to 6 business days”, “Express, 1 to 3 business days”), state your dispatch cut-off time near the buy button, and show cut-off dates for peak periods. Before Christmas, our Christmas cut-off guide has the dates and wording.
Fix 9: Remove Errors and Test on a Real Phone
Website errors and crashes caused 17% of abandonments in Baymard’s data. The same research found 31% of sites lack inline form validation and 34% do not retain card details after an error. Shopify’s hosted checkout handles much of this, but your apps, scripts and theme sit around it. Place three test orders every month, on an iPhone, an Android phone and a desktop, using mobile data rather than Wi-Fi. Use a discount code, an express checkout and a BNPL option in at least one of them. If anything feels slow or confusing, your customers feel it three times as much.
If you want a structured way to find these leaks across your whole store, not only the checkout, our 10-point Shopify CRO audit is the next step. The Platform section of the free More Orders Scorecard also checks checkout friction as part of its two-minute diagnostic.
What to Do After They Leave: The Recovery Sequence
Fixing the checkout reduces how many people leave. A recovery sequence wins back some of those who still do. Power Retail’s survey found 76% of Australian shoppers had received a follow-up email after abandoning a cart, and 13% of those went back and bought. Most stores have a flow. Few have a good one.
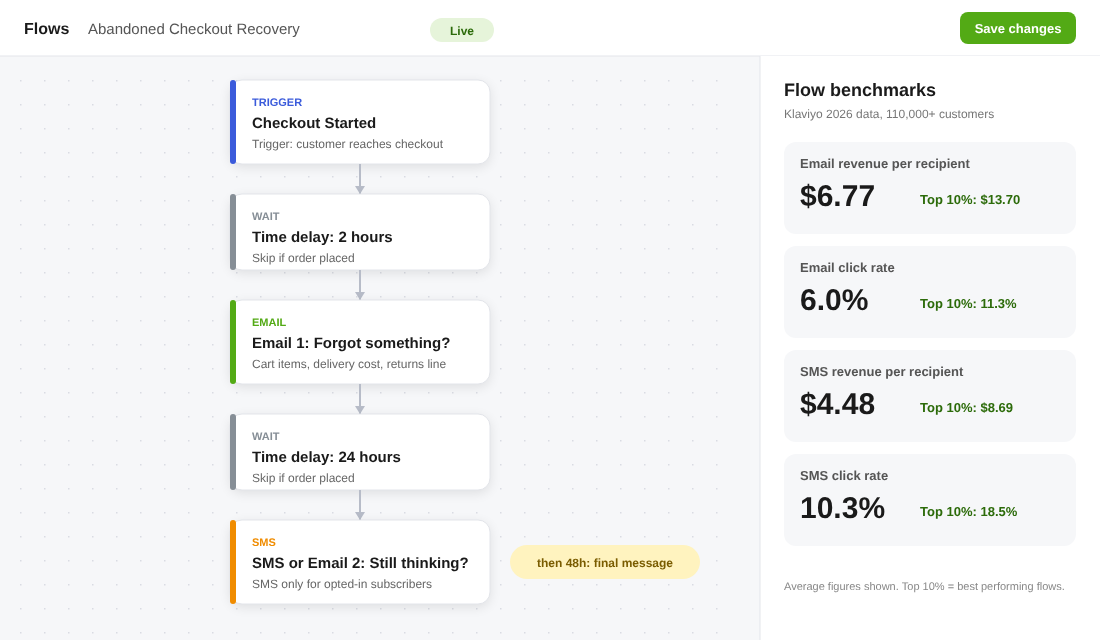
Klaviyo’s 2026 data from more than 110,000 customers puts the average abandoned cart email at $6.77 revenue per recipient with a 6% click rate, and the top 10% of flows at $13.70 and 11.3%. For SMS, the average is $4.48 per recipient with a 10.3% click rate, and the top 10% reach $8.69 and 18.5%. If your flow is below average, you have easy money sitting there.
How to Set It Up in Klaviyo
- In Klaviyo, go to Flows, then Create flow, and choose the Abandoned Checkout template (the trigger is Checkout Started).
- Set the first delay to 2 to 4 hours. Klaviyo’s own example sequence uses this window, and it catches people while the intent is fresh.
- Write email 1 as a reminder, not a sale: show the cart items, the delivery cost and your returns promise. This directly answers the top three reasons shoppers leave.
- Add a second message at about 24 hours. If you collect SMS consent, use SMS here. If not, use a second email with social proof (reviews, FAQs).
- Add a final message at about 48 hours. This is the only message where an incentive belongs, and free shipping often beats a percentage discount.
- Turn on the flow filter to exclude anyone who has placed an order since the trigger, and turn on smart sending so nobody gets three messages in one day.
- No Klaviyo? Shopify’s built-in abandoned checkout emails are under Settings, then Checkout. They are basic, but they are better than nothing.
Two cautions. First, SMS in Australia needs express or inferred consent under the Spam Act 2003, so only text people who opted in. Second, Power Retail’s analysis flagged a trade-off with incentives: discount codes sent after abandonment can train shoppers to abandon on purpose. That is why I keep the discount out of messages one and two. Our abandoned cart recovery flow guide has the full seven-email architecture, and the nine Klaviyo flows every store needs shows where this fits.
The Compound Effect: Why Small Fixes Stack
No single fix above will rescue a checkout. Together they will. Delivery costs shown early reduce the cart-to-checkout drop-off, because the shock happens on the product page where it costs nothing. Express checkout and fewer fields reduce the checkout-to-order drop-off, because there is less to type. Trust and returns information remove the last-second doubt. The recovery flow then catches a share of everyone who still leaves.
Go back to the earlier example: 5,000 carts, 70% abandonment, $95 average order value. Say shipping clarity brings abandonment down one point, express checkout and fewer fields another two, trust and delivery information another one, and a stronger recovery flow wins back one more. That is five points, or about $23,750 a month, on the same ad spend. Again, that is illustrative, but notice how none of the changes needs a developer or a new traffic source.
That is the real reason cart abandonment deserves more attention than your next ad test. It multiplies the value of everything you spend upstream. Lower your customer acquisition cost and you lose a percentage of spend. Fix abandonment and you recover revenue you have already paid for.
The 5-Minute Checkout Leak Audit (Copy This)
Run this on your own store, on your phone, in a private browser window. Score one point for each yes.
- Can a shopper see the delivery cost or free shipping threshold on the product page without clicking?
- Is the full cost (shipping, GST-inclusive total) visible in the cart before checkout?
- Do express checkout buttons (Shop Pay, Apple Pay, Google Pay) appear on the product and cart pages?
- Does checkout work without creating an account?
- Do you offer at least one BNPL option, with the instalment amount shown before checkout?
- Does the checkout ask for 14 or fewer form elements (no company field, no optional phone number)?
- Is your returns promise stated in one line near the buy button?
- Do your shipping rate names include a delivery timeframe?
- Did a test order on mobile data take under two minutes with no errors?
- Is your abandoned checkout flow live, with a first message inside four hours and no discount in message one?
Scoring: 9 to 10 is a healthy checkout. 6 to 8 means you have clear quick wins. 5 or below means checkout friction is probably your biggest hidden cost, and this is the first thing to fix before you spend more on traffic.
A 14-Day Plan to Work Through the Gaps
| Days | Task | Where to do it |
|---|---|---|
| 1 to 2 | Pull cart-to-checkout and checkout-to-order rates for the last 90 days | Shopify Analytics funnel report |
| 3 to 5 | Add delivery cost line, threshold and progress bar | Theme editor, announcement bar |
| 6 to 8 | Turn on express checkout buttons and review BNPL options | Settings, Payments; Theme editor |
| 9 to 10 | Trim checkout fields, confirm guest checkout | Settings, Checkout |
| 11 to 12 | Add returns line, delivery timeframes and cut-off times | Product template, shipping rates |
| 13 to 14 | Rebuild or tighten the recovery flow, then run three mobile test orders | Klaviyo, your phone |
Re-pull your funnel numbers on day 30 and compare. Change one group of fixes at a time where you can, so you know which one moved the number.
Inside eCommerce Circle, checkout friction is one of the first things we look at with every member, because it sits where marketing spend meets revenue. If you want to see exactly where your store is being capped, take the free More Orders Scorecard. It takes two minutes and shows you which of the 10 P’s to fix first.