A good ecommerce gross margin sits between 50% and 70% for most Shopify stores. Australian pure-play brands often land lower, around 35% to 50%, while premium own-brand labels reach 55% to 70%. If you are below 35%, there is rarely enough left after freight, returns and ads to make a profit.
The number that matters is not the one in your product cost spreadsheet. Most founders calculate gross margin as price minus supplier cost, see 70%, and feel fine. Then the bank balance disagrees, because discount codes, inbound freight, packaging, 3PL fees, card fees and free shipping never made it into the calculation.
This guide shows you how to calculate your real ecommerce gross margin, what to compare it against in Australia, and the six levers that lift it without wrecking conversion. There is a one-page checklist at the end you can run on your own store this week.
What Ecommerce Gross Margin Actually Means
Gross margin is the share of every sales dollar left after the direct costs of getting the product to the customer. The formula is simple: (net sales minus COGS) divided by net sales, times 100.
Two words in that formula cause nearly all the damage. Net sales means revenue after discounts and refunds, not the list price on your product page. COGS means every direct cost of fulfilling the order, not just what the supplier charged you.
For an ecommerce store, a complete COGS line includes:
- Product cost at landed value, including any duty or supplier fees.
- Inbound freight from the factory or wholesaler to your warehouse or 3PL.
- Packaging such as mailers, boxes, inserts and tissue.
- Pick and pack fees, whether that is your own labour or a 3PL charge per order.
- Payment fees on every transaction, including Afterpay or Zip where they apply.
- Shipping you absorb, meaning the free shipping you offer above a threshold.
Some accountants push shipping and fees below the gross margin line. Fine, as long as you track them somewhere. What you cannot do is leave them out of the picture. Polar Analytics shows a skincare example where true COGS of $44,000 on $120,000 net sales gives a 63.3% margin, while counting only the $34,000 product cost reports 71.7%. That is an eight point gap from scope alone, and it is an illustration from a vendor, not a sourced dataset. The principle holds for every store we look at.
Gross margin is also different from net margin (what is left after all expenses) and contribution margin (what is left after COGS and variable marketing). If you want the full stack, our complete guide to Shopify profit margins covers all three. This article stays on gross margin because it is the first number that decides whether the rest of the model can work.
The Real Margin on One Order: A Worked Example
Here is a worked example. A store sells a soy candle gift set at A$100 list price. The supplier charges A$28. On paper that is a 72% margin. Now run one average order through the whole journey, with a 10% discount code applied, a 3PL fulfilling the order and free shipping over A$99.
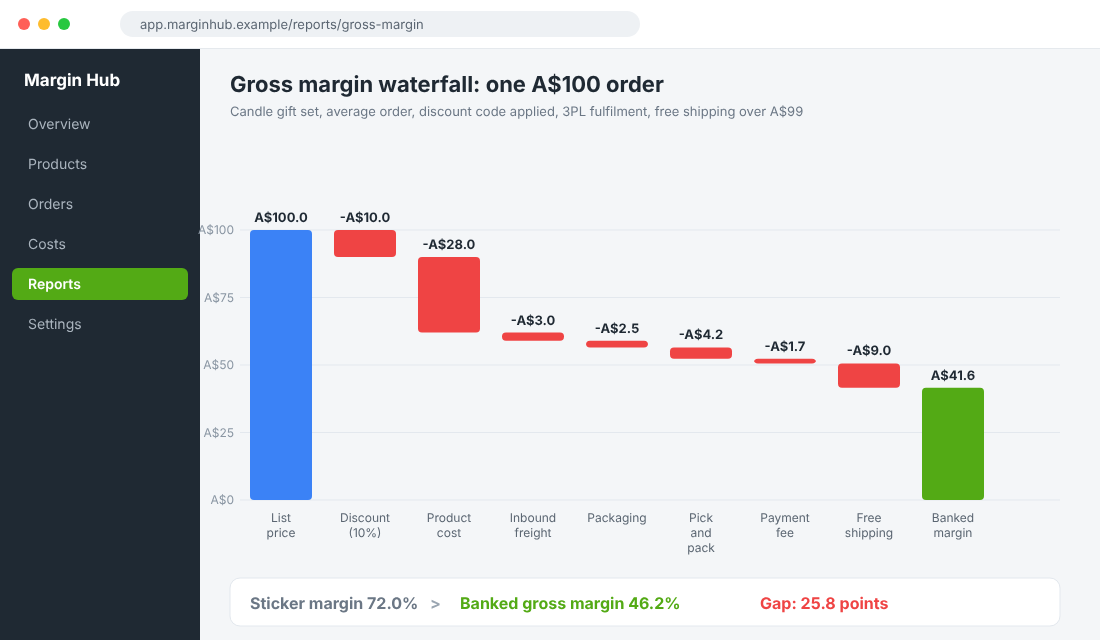
- Discount (10%): A$100 becomes A$90 net sales.
- Product cost: A$28.
- Inbound freight: A$3.
- Packaging: A$2.50.
- Pick and pack: A$4.20 at the 3PL.
- Payment fee: A$1.70 (1.55% plus 30 cents on a A$90 order, Shopify Payments on the Grow plan).
- Free shipping absorbed: A$9.
Total COGS is A$48.40. Gross profit is A$41.60 on A$90 of net sales, which is a 46.2% gross margin. The sticker margin was 72%. The gap is 25.8 points, and not one of those costs was a mistake. They are all normal. They just never appear in the supplier quote.
Now add returns. If 8% of orders come back and only half of the returned units go back on the shelf in sellable condition, the banked margin on that SKU drops again to roughly 43%. Polar describes the same pattern in an anonymised operator example, where a reported 65% margin fell to about 52% after an 8% return rate, a 6% average discount and free shipping on most orders. If returns are a live issue for you, start with our return rate benchmarks by category.
This is why the first job is never "find a cheaper supplier". The first job is to see the number you are actually earning.
What Is a Good Gross Margin for an Australian Store?
Benchmarks depend on category and model, and most published ones come from US data or from software vendors. Treat all of them as orientation, not targets. Here is what the available evidence says.
Healthy DTC range: Eightx puts healthy direct-to-consumer gross margin at 60% to 75% in its 2026 analysis, and its Australian KPI benchmark table lists 35% to 50% as the conservative range for pure-play DTC and 55% to 70% for premium own-brand, citing a RedSearch Australian public cohort from 2025. Their line is blunt: below about 35%, there is rarely enough contribution left to cover local CAC, freight and returns and still leave a profit.
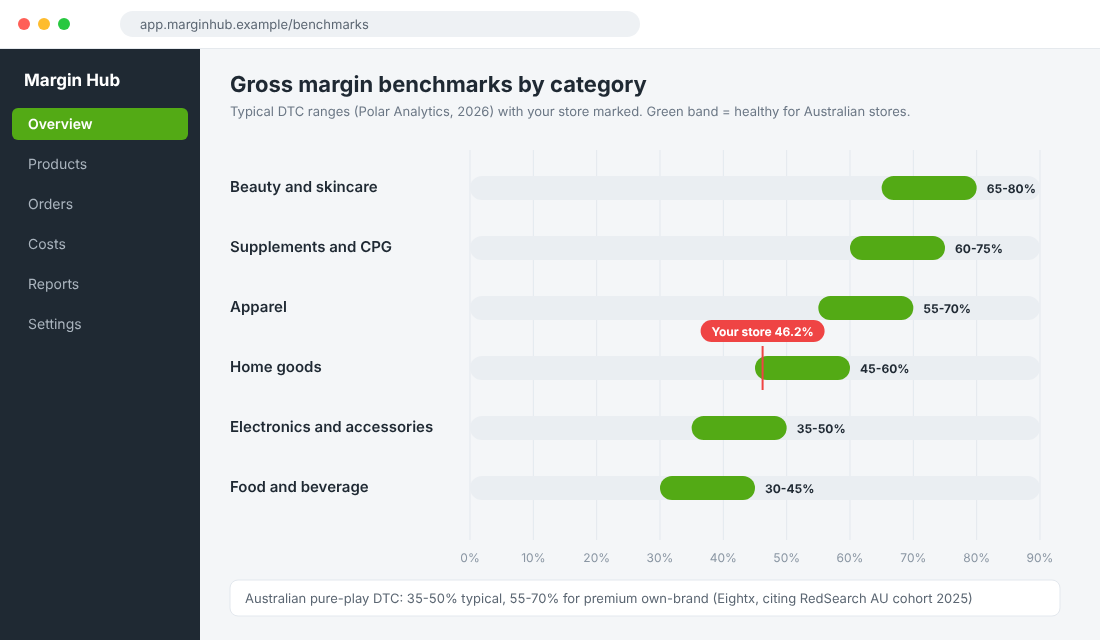
By category: Polar Analytics publishes these typical 2026 DTC ranges, which are vendor-published and not tied to a named dataset:
- Beauty and skincare: 65% to 80%
- Supplements and CPG: 60% to 75%
- Apparel: 55% to 70%
- Home goods: 45% to 60%
- Electronics and accessories: 35% to 50%
- Food and beverage: 30% to 45%
What public companies report: e.l.f. Beauty reported a 73.0% gross margin for its 2026 financial year (10-K filed May 2026). YETI sits at 55.3% on a trailing twelve month basis to May 2026, and Crocs at 58.1%. These are brands with scale, own product and strong pricing power, so they show where the top of the range sits, not where a A$600,000 a year store should expect to be.
Closer to home: Adore Beauty, the ASX-listed Australian online beauty retailer, reported a 34.8% gross margin for FY26 on a record A$207.3 million of revenue. That was down 52 basis points on the year, which the company linked to heavier first-half promotions, and its underlying EBITDA was just A$3.8 million, a 1.8% margin. A reseller of other people’s brands, with big volume and excellent operations, still lives in the mid-30s. Kogan.com is the same story at the extreme: FY26 gross profit of A$210.9 million against more than A$1 billion of gross sales, which is roughly 20 cents in the dollar on a gross sales basis (our calculation). Marketplace and reseller models run thin on purpose and make it up on volume.
The takeaway: your model sets the bar. If you make or brand your own product, aim for 55% or higher. If you resell other brands, 35% to 45% can work, but you need volume and tight operations. If you are under 35% on a small base, something has to change.
The Six Levers That Lift Gross Margin
Most margin advice starts and ends with "raise your prices". That is one lever. Here are six, in the order we usually work through them with coaching clients, from least risky to most.
Lever 1: Fix the Discount Habit First
Discounts are the fastest leak because they hit net sales directly. A store that runs a 15% code every week trains customers to wait, and the average discount creeps up without anyone deciding it should.
Pull the last 90 days and calculate your average discount rate (total discounts divided by gross sales). Anything above 8% to 10% outside of peak events needs a reason. Then tighten the habit:
- Replace sitewide percentage codes with threshold offers, such as a free gift over A$120, that lift order value instead of cutting price.
- Give first-order codes only through email or SMS sign-up, not on a public banner.
- Exclude your lowest-margin SKUs from every code.
- Set a discount ceiling per event before Black Friday starts. Our Black Friday discount strategy shows how to work out how much you can afford to offer.
Adore Beauty’s FY26 result is a reminder from a listed company: more promotion in the first half cost it half a point of margin on more than A$200 million of sales.
Lever 2: Cut Payment and Platform Fees Where You Can
Payment fees look small per order and large per year. On Shopify Payments in Australia, the online card rate is 1.7% plus 30 cents on the Basic plan, 1.55% plus 30 cents on Grow, and 1.35% plus 30 cents on Advanced. If you use a third-party gateway, Shopify adds a transaction fee of 2%, 1% and 0.6% respectively. Buy now pay later costs more: Stripe lists Zip at 5.49% plus 30 cents in Australia.
On an A$90 order, that 30 cents alone is a third of a percent. So low-value orders carry a higher effective fee. Practical moves: use Shopify Payments to avoid the third-party fee, review whether your volume justifies moving up a plan, and check that BNPL fees are priced into products where most buyers use it. We break the whole fee stack down in Shopify payment fees in Australia.
Lever 3: Renegotiate Landed Cost, Not Just Unit Cost
Founders negotiate the unit price and forget everything attached to it. Landed cost includes freight, duty, insurance and the cost of holding stock. Three places usually hide savings:
- Consolidate shipments. Two sea freight bookings a year instead of six often cuts inbound freight per unit by a third.
- Ask for volume tiers in writing. A supplier who quotes 1,000 units at A$28 will usually have a price at 2,500 units. You need the cash flow to take it, so model that first.
- Check packaging specs. Moving a mailer down one size can lower both packaging and carrier cost on every order.
Do not chase a cheaper supplier by dropping quality. Returns and bad reviews will eat the saving in two months.
Lever 4: Fix Free Shipping Economics
Free shipping is a conversion tool paid for out of gross margin. If you absorb A$9 on a A$90 order, that is 10 points of margin on that order. The fix is not to remove free shipping. It is to set the threshold so the average order value clears it with room to spare, and to see what each shipping dollar costs.
Raise the threshold slightly above your current average order value and the order size usually follows. We cover the maths in our guide to the free shipping threshold for Shopify. Also review your carrier contract. Australia Post parcel rates, regional surcharges and 3PL zone pricing all move, and a quarterly rate check is worth an hour.
Lever 5: Shift the Mix Toward Higher-Margin Products
You rarely need every SKU to have the same margin. You need your best sellers to carry the blend. Rank your products by margin and by revenue, then ask which high-margin items are getting too little attention.
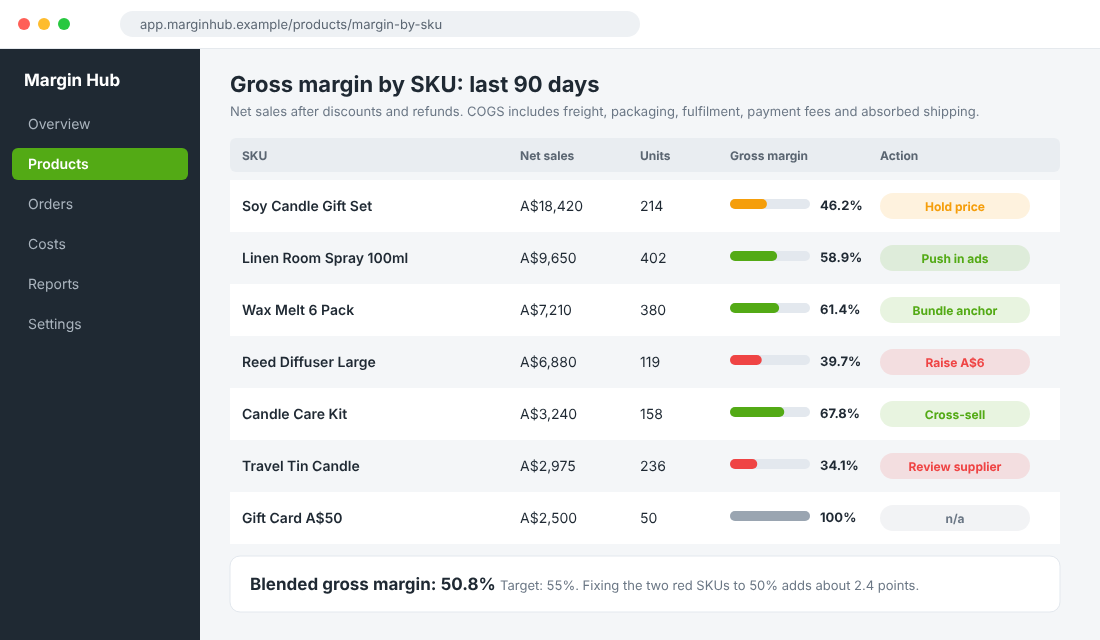
In the SKU view above, the Reed Diffuser (39.7%) and Travel Tin (34.1%) pull down a blended margin of 50.8%. The Candle Care Kit at 67.8% and the Wax Melt pack at 61.4% are the opposite. The moves here are cheap: feature the high-margin SKUs in ads and on the homepage, use them as bundle anchors, and cross-sell them in your post-purchase flow. Raising the diffuser by A$6 and fixing the tin supplier so both reach 50% would lift the blended margin by about 2.4 points, which on A$400,000 a year of revenue is close to A$10,000 in extra gross profit.
Lever 6: Reprice With Evidence
Now you can raise prices, and you will do it with data instead of nerves. Start with the products where you have the strongest demand signals: lowest return rate, best reviews, highest repeat purchase. A 3% to 5% increase on those items often has no visible effect on conversion because most buyers never compared the price in the first place.
Test one change at a time and watch conversion rate and gross profit per session for two weeks. If conversion holds, roll it out. If it dips more than the price rise gains, step back. Gross profit per session is a better judge than conversion rate alone because it rewards a smaller number of more profitable sales.
How to Track Gross Margin in Shopify: Step by Step
You do not need a new tool to start. You need clean cost data. Here is the setup.
- Step 1: Load cost per item. In Shopify admin, open a product, find the variant and fill in Cost per item. For many SKUs, export your products as a CSV, fill in the cost column, and re-import it.
- Step 2: Use landed cost. Add freight and duty into the cost per item, so it reflects what the unit really cost to land.
- Step 3: Build a monthly cost sheet. In Google Sheets, set one row per month with net sales, product cost, freight, packaging, fulfilment, payment fees, shipping absorbed and returns. Pull the totals from your Shopify reports and your accounting software.
- Step 4: Check the profit reports in Shopify Analytics. Open Analytics, then Reports, and look for the profit and margin reports available on your plan. They use the cost per item you entered.
- Step 5: Reconcile to your books. Compare your sheet to your Xero or MYOB cost of sales every month. If they do not match, a cost is missing.
- Step 6: Review by SKU every 90 days. Use the table in the screenshot above as your template.
If you want automation across channels and SKUs, paid analytics platforms such as Polar Analytics can connect your Shopify data, freight and fees and slice margin by product and channel. Worth a look once you are doing six figures a month. Below that, a clean sheet beats a dashboard nobody trusts.
The Compound Effect: Small Points Add Up Fast
None of these levers is dramatic alone. Together, they are. Run the A$100 candle order again with moderate changes: average discount down from 10% to 7%, inbound freight down A$1, shipping absorbed down A$2 through a better threshold and carrier rate, and the payment fee moving with the order value.
Net sales rise to A$93. COGS falls to A$45.44. Gross profit is A$47.56, a margin of 51.1%, up from 46.2%. That is five points from three boring changes, with no price increase and no supplier switch. Add a 4% price rise on the list price and the same order reaches about 53%.
On A$500,000 a year of net sales, five points is A$25,000 of extra gross profit. That is more than a 10% lift in revenue would add at a 46% margin (about A$23,000), and it needs no extra ad dollar. It also changes what you can afford to pay for a customer, which is where our guide to customer acquisition cost on Shopify and the break even ROAS formula pick up. Margin sets your break-even ROAS, so every point of margin you recover moves it down.
The Gross Margin Checklist (Copy This)
Run this on your store in under an hour. Write down the answer to each line.
- Net sales (last 90 days): after discounts and refunds. Number: ______
- Average discount rate: discounts divided by gross sales. Target: under 8% to 10% outside peak events.
- Landed product cost: product plus freight plus duty, per unit.
- Fulfilment cost per order: packaging plus pick and pack. Number: ______
- Payment fees: total for 90 days, divided by net sales. Typical range: 1.7% to 2.5%.
- Shipping absorbed: total free shipping cost divided by net sales.
- Return cost: refunds plus unsellable stock, divided by net sales.
- Real gross margin: (net sales minus all of the above) divided by net sales. Number: ______
- Compare: 55%+ for own brand, 35% to 45% for reseller models. Under 35%, fix before you scale ads.
- Pick two levers from the six above and set a 90-day target in points.
Pin it somewhere you will see it. Re-run it every quarter, and any time you change supplier, shipping rates, a platform plan or your discount calendar.
Common Gross Margin Mistakes to Avoid
- Using list price instead of net sales. Every discount code is a reduction in margin.
- Ignoring absorbed shipping. It is the biggest hidden line for stores with a free shipping threshold.
- Averaging across the whole catalogue. A blended 50% can hide a SKU running at 30% that you promote every week.
- Cutting quality to hit a number. The return rate rises, reviews fall, and your repeat rate drops.
- Raising prices across the board. Test on your strongest products first.
Where to Go From Here
Gross margin is the foundation of the Profit part of the More Orders Operating System. Get it right and every other decision gets easier: how much you can spend on ads, how aggressive to be on Black Friday, whether to hire, and how fast to scale. Get it wrong and growth only makes the problem bigger.
Inside eCommerce Circle, gross margin is one of the first numbers we check with every member, because it decides how much room the store has to grow. If you want to see exactly where your store is being capped, take the free More Orders Scorecard. It takes two minutes and shows you which of the 10 P’s to fix first.