A good email marketing benchmark for an Australian retail store is a campaign click rate of about 2.4% and an unsubscribe rate under 0.3% per send. Open rate is the one number you should ignore, because Apple Mail makes it look better than it is. Revenue per recipient and flow performance are the figures that tell you whether email is actually earning its keep.
What’s in This Article
Most Aussie founders do the opposite. They open Klaviyo, see a 38% open rate, feel good, and move on. Then they wonder why email drives a tiny slice of revenue and why the list feels tired. The benchmark was never the problem. They were measuring the wrong thing against the wrong yardstick.
This article gives you the real numbers, where each one comes from, which ones to trust, and a one-page scorecard you can fill in this afternoon. If you want the frequency side of this, read our email frequency guide alongside it.
The Australian numbers: what a good open and click rate looks like
Start with the local data. Campaign Monitor’s Australian Email Benchmarks 2025, built on 2.4 billion sends and reported by Rocking Web, puts retail and ecommerce at a 17.3% open rate, a 2.4% click rate and a 0.29% unsubscribe rate per send. The all-industry Australian average sits higher: 21.5% open, 2.8% click, 0.24% unsubscribe.
Retail is the lowest open rate in that table. That is not a sign Aussie stores are bad at email. Retail lists are big, they get hammered with promotions, and shoppers sign up for a discount code and never open again.
| Metric | Australian retail (Campaign Monitor 2025) | All Australian industries |
|---|---|---|
| Open rate | 17.3% | 21.5% |
| Click rate | 2.4% | 2.8% |
| Unsubscribe rate per send | 0.29% | 0.24% |
Treat those as a floor to check against, not a target. A store with a clean, engaged list should beat the click rate comfortably. A store that blasts everyone twice a week will sit near the unsubscribe number and wonder why.
Now the global comparison. Klaviyo’s 2026 data, as summarised by Branvas, shows the average ecommerce campaign at a 31.0% open rate, 1.69% click rate and 0.16% placed order rate, with revenue per recipient of $0.32. Those are US dollar figures from a global dataset, and the open rate is inflated by the Apple issue below. Notice the click rate is actually lower than the Australian retail figure. Different datasets, different definitions. Do not mix them in the same row of a spreadsheet.
Why your open rate is lying to you
Since Apple Mail Privacy Protection arrived, Apple pre-loads the tracking pixel in your emails whether or not the person reads them. Boomerang AI’s 2026 write-up, which cites a study of 939 companies and roughly 15 billion emails, reports that Apple Mail Privacy Protection accounts for 49.29% of tracked opens. It puts the average reported open rate with machine opens included at about 43%, versus about 19% when adjusted, and estimates genuine human opens at 20 to 25%.
Treat that as one vendor’s analysis rather than gospel. The direction is not in dispute, though. Klaviyo’s own benchmark guide warns that open rates have been inflated since iOS 15 because Apple prefetches tracking pixels.
What this means in practice:
- Never judge a subject line test on open rate alone. A winning variant might just have been sent to more Apple Mail users.
- Do not compare your open rate to any benchmark post, including this one. Compare it only to your own history, and only loosely.
- Use clicks and orders as the scoreboard. A machine cannot click a link or place an order.
We covered the full replacement set of numbers in the email metrics audit. The short version: clicks, placed order rate, revenue per recipient, unsubscribe rate and flow share of revenue.
Revenue per recipient: the benchmark that pays the bills
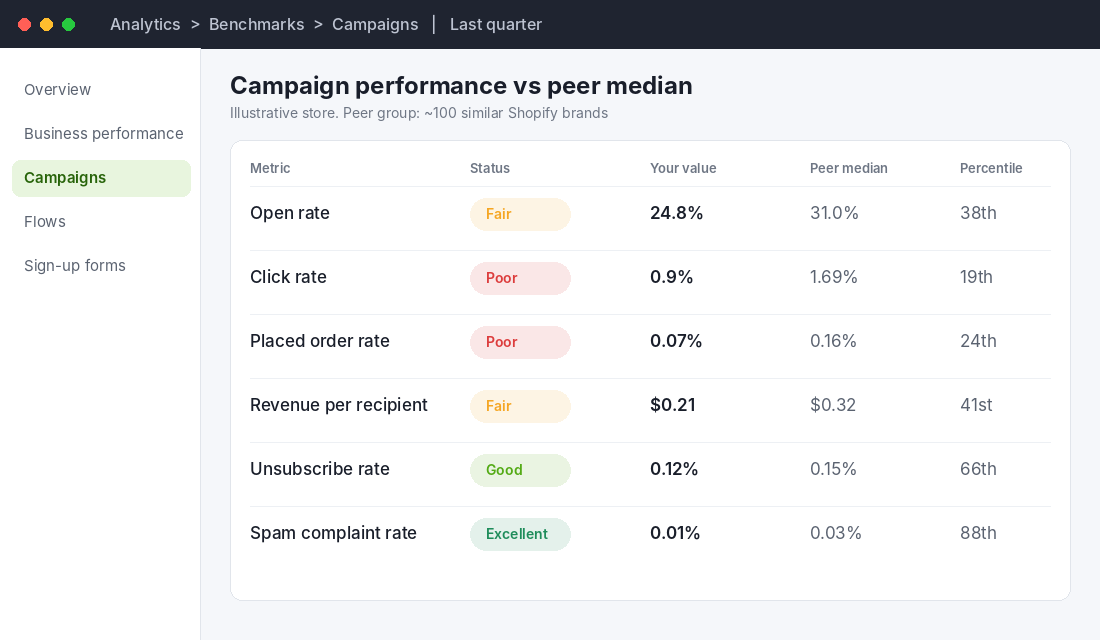
If you track one email number, make it revenue per recipient (RPR). It is total attributed revenue divided by recipients, so it combines click rate, conversion rate and order value into a single figure. It cannot be inflated by Apple.
The Klaviyo 2026 averages reported by Branvas show how big the gap between campaigns and flows is:
| Metric | Campaigns (avg) | Flows (avg) | Top 10% of flows |
|---|---|---|---|
| Open rate | 31.0% | 32.2% | 45.8% |
| Click rate | 1.69% | 5.58% | 10.48% |
| Placed order rate | 0.16% | 2.11% | 4.30% |
| Revenue per recipient | $0.32 | $2.54 | $5.26 |
Read the last row twice. The average flow earns roughly eight times more per recipient than the average campaign. The best flows earn about sixteen times more. That is the single most useful benchmark in this article, because it tells you where to spend your next hour.
Omnisend’s data points the same way. Their 2025 figures, reported by Branvas, show automated emails making up about 2% of send volume but about 37% of email-driven revenue, with $2.87 revenue per automated email versus $0.18 per scheduled campaign email. Smaller senders are even more lopsided, because they usually have no flows at all. Our guide to the 9 Klaviyo flows every store needs is the build list.
One caution on currency. Almost all of the large benchmark datasets report in US dollars. For an Australian store, treat the dollar figures as a ratio. If your campaign RPR is a quarter of your flow RPR, you are in the normal zone. If your flows barely out-earn your campaigns, something is broken in the flows.
Flow benchmarks: welcome, cart and post-purchase
Flows are where the benchmarks get specific. These ranges come from Branvas’s roundup of Klaviyo, Omnisend and Drip data, so treat them as ballparks and check the date on each source before you quote them to a team member.
| Flow | Open rate | Click rate | Placed order rate |
|---|---|---|---|
| Welcome series | 41.92% | 5.54% to 6.11% | 2.32% |
| Abandoned cart (Klaviyo 2024) | 50.5% avg, 65.34% top 10% | 6.25% avg, 13.33% top 10% | 3.33% avg, 7.69% top 10% |
| Browse abandonment | n/a | n/a | 0.95% |
| Back-in-stock (Omnisend 2025) | 59.19% | n/a | 5.34% |
Two things stand out. First, abandoned cart is the highest-value flow by a distance, with an average revenue per recipient of $3.65 in the Klaviyo 2024 figures and $28.89 for the top 10%. Second, the gap between average and top 10% is enormous. That gap is the opportunity.
If your cart flow converts under 3%, the usual causes are a first email sent too late, a single email instead of three, no reminder of the exact product, and a discount offered too early. Club L London, a UK fashion brand, sends its first abandoned checkout email within an hour and reports that email converts nearly 11%, with a next-day reminder converting a further 7%. Their welcome flow converts at 11%, which Klaviyo’s case study says is about five times the sector benchmark. Email and SMS now drive 33% of their direct-to-consumer revenue, and the welcome and abandoned cart flows produce about two thirds of that. UK, not Australian, but the mechanics carry over.
An Aussie example: Budgy Smuggler and the case for sending less to more targeted people
Budgy Smuggler, the Australian-made swimwear and apparel brand on Shopify Plus, is a useful local example. In Klaviyo’s 2023 case study, the brand reports that Klaviyo drove 30% of total revenue, grew Klaviyo-attributed revenue 45% year on year, and returned 30x ROI.
How did they get there? They stopped treating the list as one audience. Print launches go to the customers most likely to want that print. Shoppers who viewed the pink pineapple print get retargeted, and those emails hit a reported 50% open rate. Fans of AFL and NRL clubs get club-specific messaging, and after the grand finals, supporters of the winning club got an SMS offer for the premiership pair, which produced a 28% SMS click rate.
Notice what is missing from that story: a benchmark. Budgy Smuggler did not win by hitting an industry average. They won by sending messages that were obviously relevant to one person. When your campaign click rate sits below the Australian retail figure of 2.4%, the fix is rarely a better subject line. It is a smaller, sharper segment.
How to find your own benchmarks inside Klaviyo
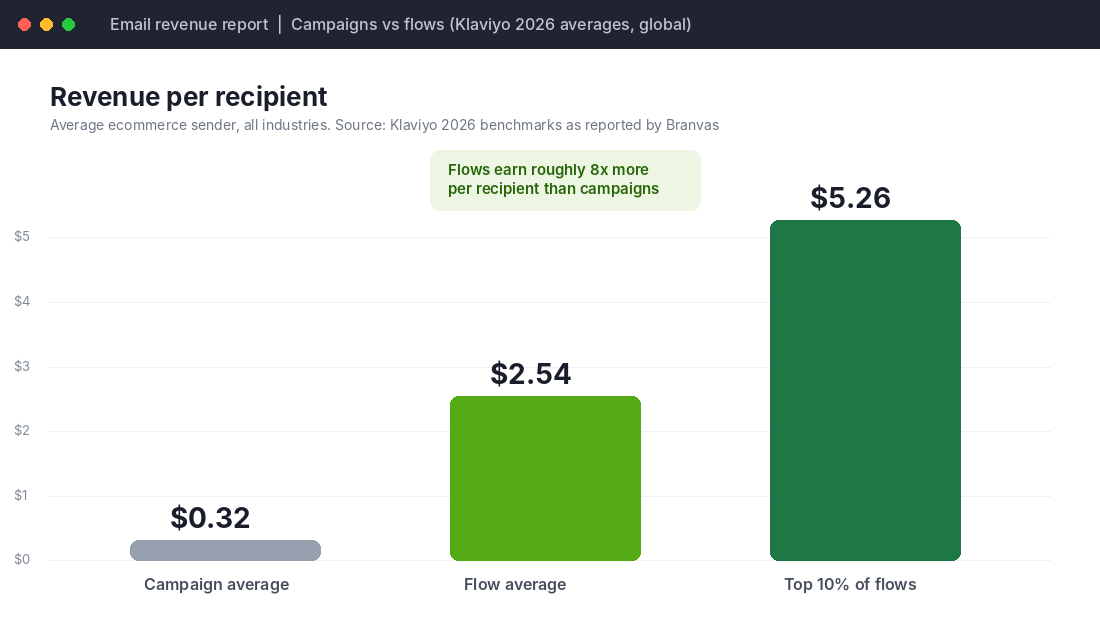
You do not need to rely on blog posts. Klaviyo shows you how you compare to about 100 similar companies, if your account qualifies. Here is the setup, based on Klaviyo’s own help guide:
- Go to Analytics, then Benchmarks. You will see five pages: Overview, Business performance, Campaigns, Flows and Sign-up forms.
- Scroll to the bottom of any page and confirm the industry used for your comparison. If it is wrong, click Change industry, update it and save.
- Open Campaigns and choose Last quarter. Turn on Detailed View to see your percentile plus the 25th and 75th percentile values.
- Open Flows, pick a flow type such as welcome series or abandoned cart, and compare against peer data.
- Write down every metric rated Poor or Fair. Ignore open rate. Those are your fix list.
Two caveats. Klaviyo says benchmarks are available only to accounts in its US data region, and email benchmarks need at least 25 delivered emails in the last six months. Data refreshes on the 10th of each month. If you cannot see the Benchmarks page, your account may not be eligible, so use the scorecard below with the public numbers instead.
If you are weighing platforms and pricing before you commit, our Klaviyo vs Omnisend comparison covers the trade-offs.
The email benchmark scorecard (copy this)
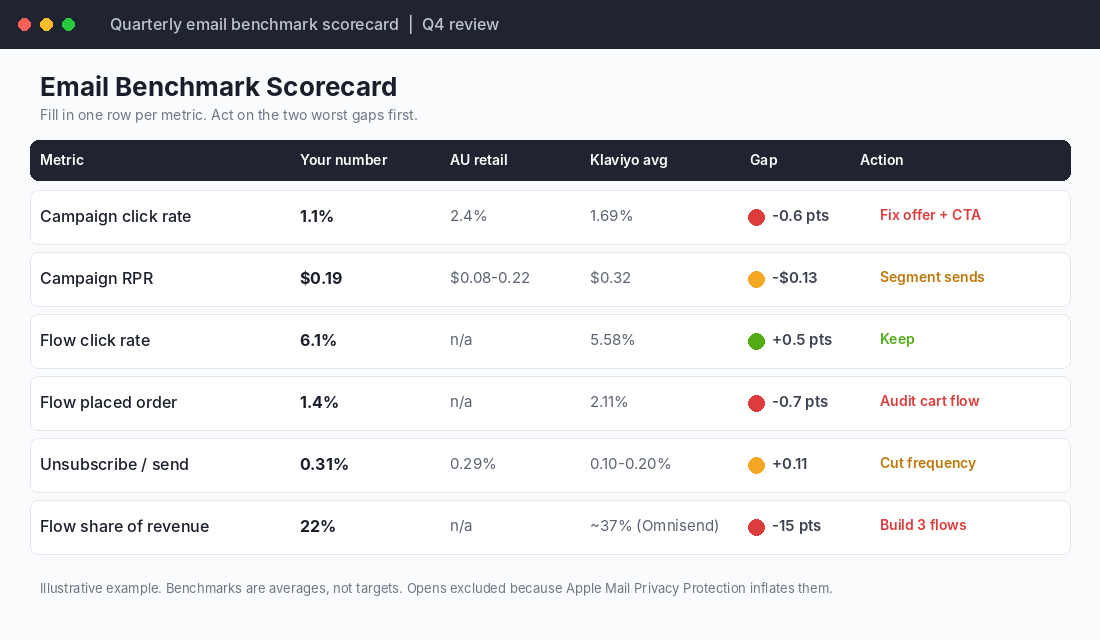
Here is the template we use with members. Once a quarter, fill in one row per metric. Do not add opens.
| Metric | Your number | Australian retail | Klaviyo average | Action if below |
|---|---|---|---|---|
| Campaign click rate | 2.4% | 1.69% | Shrink the segment, sharpen the single offer | |
| Campaign revenue per recipient | $0.08 to $0.22 (unsourced estimate) | $0.32 (USD) | Stop sending to unengaged contacts | |
| Flow click rate | n/a | 5.58% | Rewrite the first email in each flow | |
| Flow placed order rate | n/a | 2.11% | Audit the cart flow timing and email count | |
| Unsubscribe rate per send | 0.29% | 0.10% to 0.20% | Cut frequency or split the list | |
| Flow share of email revenue | n/a | about 37% (Omnisend) | Build the missing flows first |
A note on the Australian revenue-per-email range: the $0.08 to $0.22 figure appears on one Australian agency page with no cited source, so we label it an estimate. Use your own history as the real baseline.
How to use the scorecard without fooling yourself
Benchmarks are averages, not targets. A store selling $400 coffee machines should not expect the same click rate as one selling $15 candles. Every benchmark source we checked says this in some form, and every founder ignores it.
Use this process instead:
- Fill in the scorecard from the last 90 days. Pull flows and campaigns separately. Blending them hides the problem.
- Rank the gaps by dollars, not percentages. A 0.7 point shortfall in cart flow placed order rate is worth far more than a 0.5 point shortfall in campaign clicks.
- Fix the two biggest gaps only. Not five. Retest in 30 days.
- Compare to yourself next quarter. Your own trend beats any industry average.
- Check list health before blaming content. Our deliverability playbook covers authentication and spam placement.
If your unsubscribe rate is climbing, the fix usually sits in frequency, not copy. Drop the contacts who have not clicked in 180 days from your regular campaigns and put them in a separate win-back sequence.
Five fixes that lift click rate fast
If your campaign click rate sits below 2.4%, work through these in order. They are ranked by how often they turn out to be the cause in the stores we review.
- One email, one job. Three product blocks, a blog link and a discount banner split attention. Pick one offer and one button.
- Send to engaged contacts first. Start with people who clicked or bought in the last 90 days. Then widen the audience only if the first send performs.
- Cut the list, not the schedule. A smaller list that clicks beats a bigger one that drags your engagement and your inbox placement down.
- Put the offer above the fold on mobile. Most Australian shoppers read email on their phone. If the button needs a scroll, many will not see it.
- Match the email to the last thing they did. Someone who browsed running shoes should not get your homewares sale. Even basic browse and purchase segments help.
Each of these is free. None needs a new tool. The stores that treat the click rate benchmark as a prompt to tighten the list, rather than a score to be embarrassed by, are the ones whose numbers move.
A 30-day plan to get your numbers in order
Benchmarks only help if they change what you do on Monday. Here is a simple month.
- Week 1: Fill in the scorecard. Export the last 90 days of campaign and flow data. Mark every metric below the benchmark.
- Week 2: Fix the biggest flow gap. For most stores that is the abandoned cart flow: three emails, first one inside the hour, product image in every email.
- Week 3: Clean the list. Suppress contacts with no clicks in 180 days from regular campaigns and move them into one win-back sequence.
- Week 4: Re-run the scorecard on the new data and check unsubscribe rate and revenue per recipient. Decide the next two gaps to attack.
Do not expect a perfect score at the end of 30 days. The goal is a baseline and a direction. A store that does this four times a year has a year of its own benchmark data, which is worth more than any industry report.
Seasonal reality check: benchmarks break in November
Black Friday is on 27 November 2026, and every benchmark in this article will wobble around it. Send volume spikes, inbox competition spikes, and click rates on campaigns often drop while revenue per send rises because offers are stronger. Do not panic when the numbers look odd in the last week of November. Compare November to last November, not to October.
If you are planning those sends now, start with our Black Friday subject lines post, and read the repeat customer rate benchmarks to judge whether the buyers you win in the sale are likely to come back.
The compound effect: how the numbers connect
These metrics are not separate dials. They are one chain. A clean list lifts deliverability. Better deliverability and tighter segments lift click rate. A higher click rate on a well-timed flow lifts placed order rate. A higher placed order rate lifts revenue per recipient. And a rising share of revenue from flows means email earns even in the weeks you send nothing.
That is why we steer members away from chasing open rate. It sits at the start of the chain and measures almost nothing. Revenue per recipient sits at the end and measures everything. Build your reporting backwards from the end.
Inside eCommerce Circle, email is one of the core levers we work on with every member, and it sits inside the Performance and Promotion pillars of the 10 P’s. If you want to see exactly where your store is being capped, take the free More Orders Scorecard. It takes two minutes and shows you which of the 10 P’s to fix first.